06 Performance
Performance answers whether service is degraded by response time, CPU, memory, or DB time.
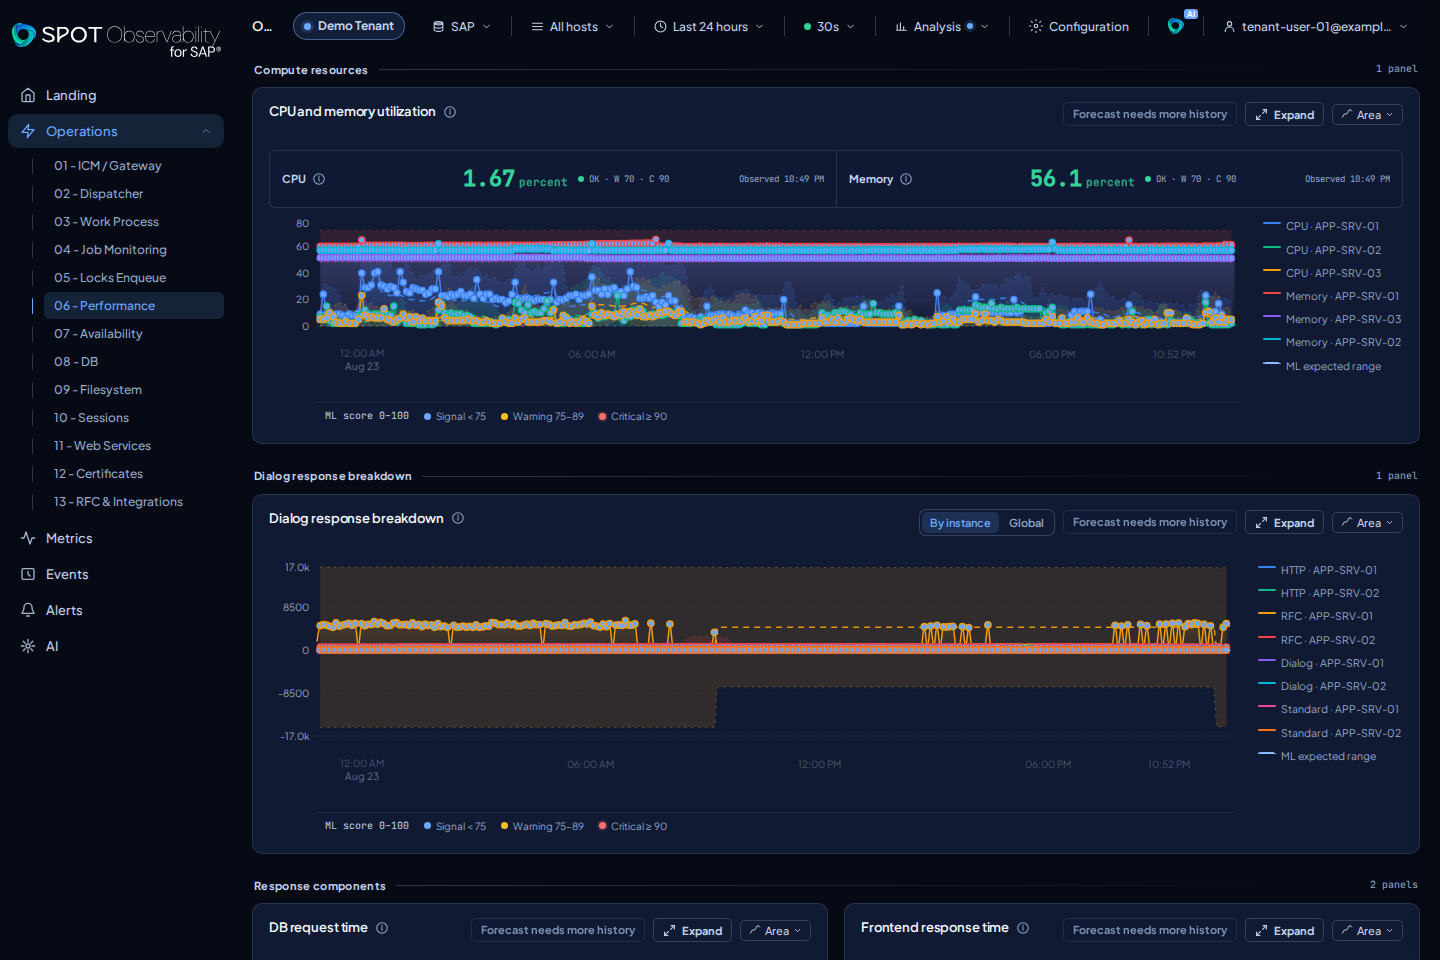
What appears
- CPU and memory utilization: a compact rail shows current value, state, thresholds, and freshness; the recovered space enlarges per-host series while preserving the Analysis overlays for every series.
- Dialog response breakdown: all eight historical HTTP/RFC/Dialog/Standard queries remain in one panel. The selector switches between By instance and Global without changing the queries.
- DB request time and Frontend response time as two equivalent panels.
- Memory breakdown: one row per server with RAM and swap configured/used/free, size, and maximum; percentages are calculated from the MB values in the latest complete snapshot.
Visual composition does not merge the data: every query retains its unit, filters, series identity, and unambiguous legend. A member without data is marked as partial without hiding valid series.
How to interpret it
- OK: response time is stable and resources are not under pressure.
- WARN: degradation is gradual, repeated peaks appear, or one resource starts diverging from the baseline.
- KO: response time stays high, resources are near limit, or users are likely experiencing degraded service.
Performance is a correlation domain. CPU, memory, DB time, and dialog time tell different parts of the same story. A CPU peak without dialog impact may be acceptable; a DB-time spike with dialog response and job failures is more urgent.
Filters and next screens
Compare hosts when there are multiple SAP instances. Open Metrics for raw charts, DB for engine-specific signals, Work Process for saturation, Events for errors around the spike, and AI when you want a guided correlation summary from the active target and time range.