01 ICM / Gateway
This domain answers whether inbound HTTP/RFC channels are healthy or affected by connection errors, thread saturation, or ICM failures.
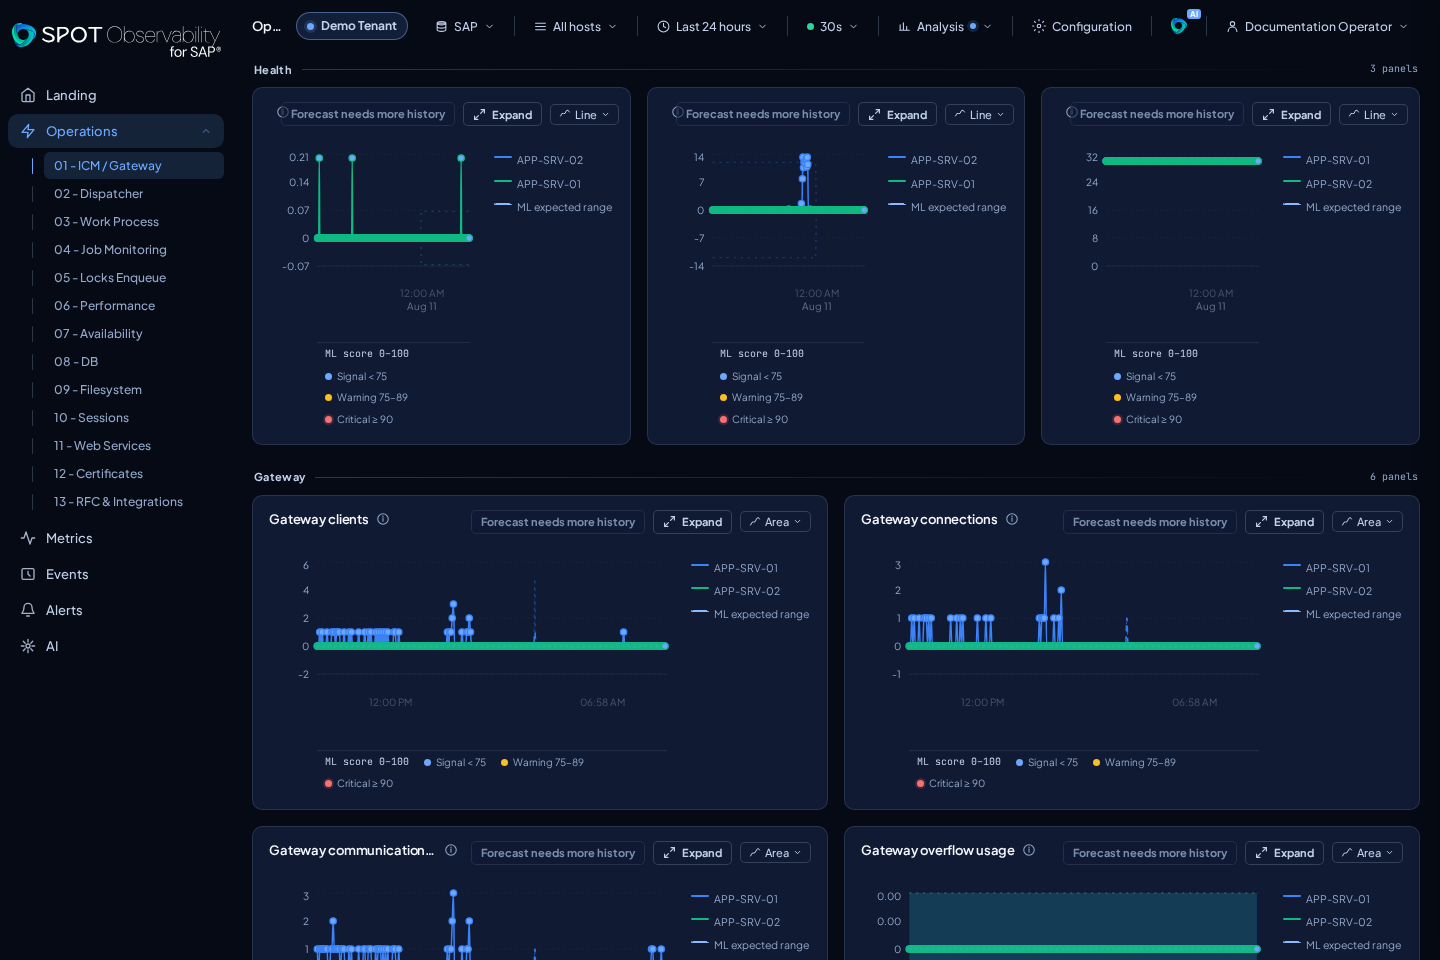
What appears
- Health: Error rate, Connect error rate, and Thread count as three same-sized line charts. Thread count displays the gauge published by SAP; it is not derived from another signal.
- Gateway: the six historical HTTP/RFC queries remain independent charts, arranged in pairs for easier comparison.
- Events remains at the end of the domain.
The raw ICM error counter and ICM connect errors counters remain available in Metric Explorer, but are not shown as Operations panels.
ICM error rate and ICM connect error rate do support forecast. Their
availability diagnosis appears only after enabling Forecast in Analysis;
with the layer off, no recent-data warning is shown.
How to interpret it
- OK: error rates are low and threads remain inside the expected operating range.
- WARN: errors increase repeatedly, thread usage trends upward, or connection errors appear in bursts.
- KO: failures are frequent, inbound channels cannot serve traffic reliably, or the ICM/Gateway layer is visibly affecting users or integrations.
Separate accepted-request errors from connection errors. ICM errors usually mean the request reached the ICM and failed later. Connect errors often point to an edge, listener, network, or capacity problem before normal request handling.
Filters and next screens
Filter by host when only one instance is affected. Then cross-check Events for ICM/Gateway messages, the Landing map for node concentration, Metrics for raw series, and Performance if the backend response time also rises.