Landing
Landing is the first screen for a shift or daily review. It summarizes current health and first answers what function is degraded; Operations pages explain where, why, and when it happens.
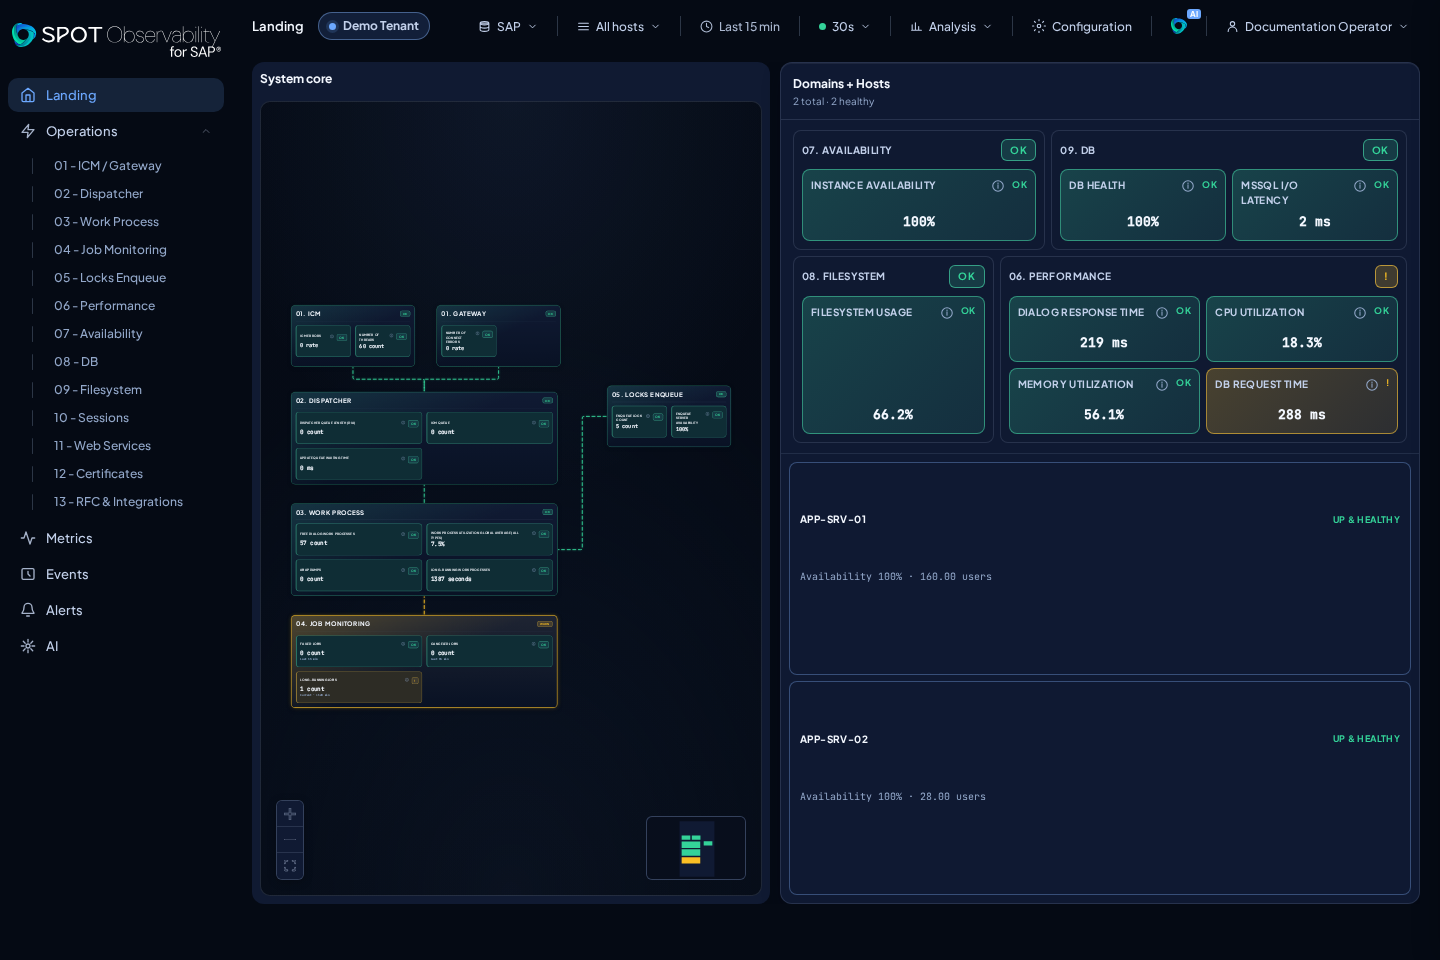
Landing metrics for domains 02–05
Visible titles remain in English and use sentence case. The identifier in parentheses is the canonical metricId that you will also find in Metrics and the technical inspector.
| Domain | Current health shown |
|---|---|
| 02 Dispatcher | Dispatcher queue length (DIA) (dialog-queue-length), ICM queue (icm-queue), and Update queue waiting time (update-queue-waiting-time) |
| 03 Work Process | Free dialog work processes (free-dialog-wps), Work process utilization global average (all types) (work-process-utilisation-global), ABAP dumps (abap-dumps), and Long-running work processes (long-running-work-processes) |
| 04 Jobs | Failed jobs (failed-jobs), Canceled jobs (canceled-jobs), and Long-running jobs (long-running-jobs) |
| 05 Locks Enqueue | Enqueue lock count (enqueue-lock-count) and Enqueue server availability (enqueue-server-availability) |
Landing no longer shows Update queue actual or Work process utilization by type. These are diagnostic signals and appear in their Operations domains.
How current state is calculated
- A gauge or state metric uses the latest real sample; the value is not the average or maximum of the selected range.
- An event counter can show
0when there is a valid observation with no events. - If there is no sufficiently recent sample, the card shows
UNKNOWNin grey. SPOT does not turn missing signal into zero or an OK state. - Normal freshness is three collection intervals; when the source does not declare its interval, SPOT uses 15 minutes.
Long-running jobs uses dedicated per-server XBP snapshots. A fresh 0
confirms a successful query with no jobs running for strictly more than
120 minutes; exactly 120:00 is excluded and 120:01 is included. Missing data,
an error, or lost freshness produces UNKNOWN. It is not replaced with Work
Process or demo data.
How to read it
- Confirm target and time window.
- Review WARN or KO cards.
- Treat
UNKNOWNas missing evidence, not healthy state. - Open the related domain for breakdowns and trends.
- Switch to Events for recent degradation.
- Use the Landing map when the issue looks instance-specific.
Good practices
- Do not close a diagnosis from a single KPI.
- Use Operations and Metrics to distinguish an isolated peak from a sustained trend.
- If a card is
UNKNOWN, check ingestion, source, and filters before interpreting health. - Keep the same target and host when moving to Operations, Events, Jobs, or Metrics.
- Landing prioritizes current health; Metric Explorer works exclusively with time series.