10 Sessions
Sessions shows the visible volume and distribution of users or sessions for operations.
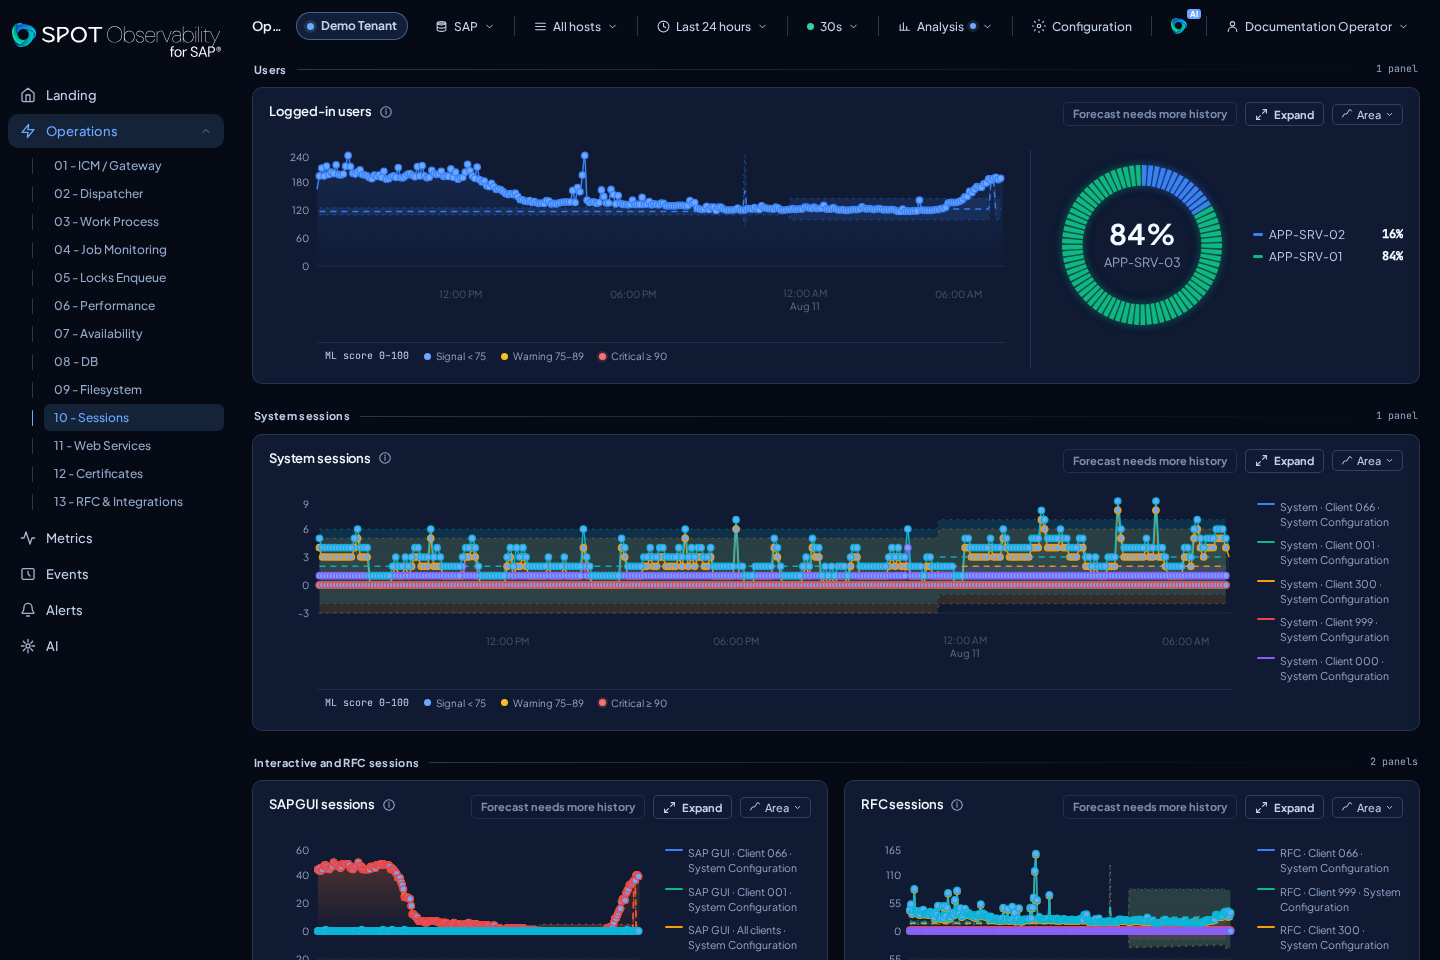
What appears
- Users logged in and Users by server in an 8/4 time-series and donut composition.
- System sessions as a full-width summary.
- SAP GUI and RFC sessions as two independent, equally sized panels.
- APC and Plugin sessions as another two independent panels.
The five session types are not merged into one curve: every signal retains its query, scale, and identity.
How to interpret it
- OK: volume matches the expected pattern for the hour and business calendar.
- WARN: session count deviates meaningfully from the normal pattern.
- KO: there is a concentration, drop, or imbalance that affects operation or explains another degraded domain.
Session count is most useful as context. A sudden increase can explain response-time or work-process pressure. A sudden drop can indicate access, ICM, availability, or authentication problems.
Filters and next screens
Cross-check Performance when load rises, Events when access or communication errors appear, and the Landing map when sessions concentrate on one instance. If the pattern is business-calendar related, compare with Jobs and known processing windows.