AI
AI summarizes evidence from the active global target and selected time window. Use it as operational support, not as a replacement for reviewing data.
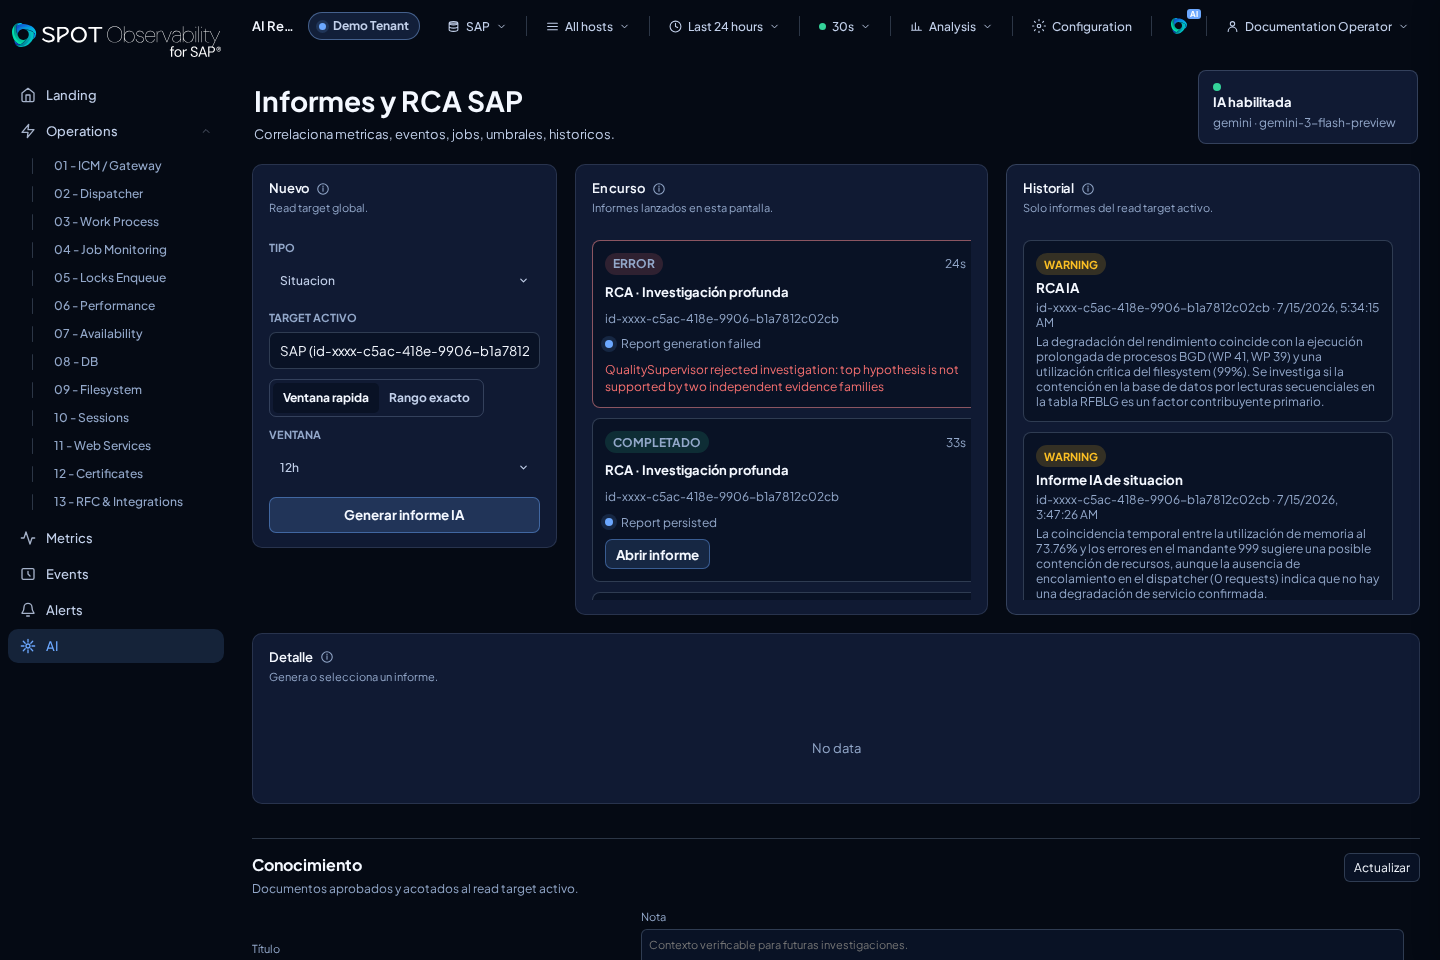
Recommended uses
- Ask for a summary of the last hours.
- Generate a situation report for an on-call handover.
- Ask for RCA when there is a specific incident or degradation.
- Ask the assistant to explain a screen or Operations domain.
- Correlate events, jobs, and metrics.
- Generate a conservative next-step hypothesis.
- Summarize what is not failing as well as what is degraded.
Good questions
- What changed in the last hour?
- Which evidence explains the KO state?
- What should be cross-checked in Events?
- Is there correlation with canceled jobs?
- Which host should be checked first?
AI uses the active target and selected time window. If the selected source has no data, the report cannot produce useful evidence. Treat AI output as a structured investigation aid and verify the cited screens before acting.
Contextual Copilot
The right panel follows the screen where you are working. You can resize it, expand it into a workspace, or use it full-screen on mobile. The copilot receives a reduced context from Landing, Operations, Metrics, Events, Jobs, the Landing map, or AI: view, selection, visible metrics, and time range. It never replaces the selected SAP source.
Pin the context when you want to keep one screen as a reference while navigating. Responses can include citations, evidence, tables, real charts, and actions to open a metric, navigate to another view, or start a report. You can also cancel a request, retry a failure manually, and rate the result. All actions are read-only or navigation; the copilot does not modify SPOT or SAP.
Reports and Time Range
AI reports can use two time-window modes:
Quick window: presets such as last hour, last hours, or recent day.Exact range: start and end date/time for incidents with a known timestamp.
Use Exact range when you have a change, outage, or alert with a concrete time. The range must start before it ends and respect the backend maximum. SPOT uses the same SAP source selected in the console; AI does not have a separate target selector.
While a report is being generated, the In progress panel shows phase, elapsed time, target, and result. Reports and RCA run as asynchronous jobs: they may take longer because SPOT prioritizes collecting evidence, testing several hypotheses against counterevidence, synthesis, quality review, and safety validation before saving the result. RCA requires next investigation checks, a timeline when dated events exist, and a chart when real series are available. If the LLM or a quality gate fails, the error remains visible in that tray and an incomplete report is not saved as completed.
When the run finishes, SPOT opens or exposes the final report in history. The workspace separates Overview, Timeline, Hypotheses, Evidence, and Investigation. Selecting evidence lets you cross-check it against related milestones and hypotheses. This separation prevents a long investigation from blocking the console.
History and In progress scroll independently so the selected report remains visible even when many investigations are stored.
You can cancel a run you no longer need. Cancellation is cooperative: the state changes to canceled after the current safe phase finishes. Pending runs can recover after a service restart without losing their progress history.
Export and Compare Reports
Reports can be exported as Markdown or copied to clipboard from the detail toolbar. This allows sharing reports in on-call channels, tickets, or internal documentation.
Visual comparison lets you select a previous report from history and display the differences: verdict change, new findings, resolved findings, and key metric variations. Useful for validating whether a corrective action had effect.
AI Analytics
The Analytics panel shows AI system usage metrics for the selected period (24h, 7d, 30d): reports generated, chat sessions, average quality, failure rate, positive feedback, active provider, and the most used tools. Allows the administrator to evaluate whether AI is being used and with what results.
Basis and Business Chat
Chat is designed to feel faster than a full report. It shows planning, tool, and synthesis progress through SSE and uses a shorter investigation budget to provide an operational preliminary answer. If the LLM provider returns an empty answer, hits token limits, or fails transiently, SPOT retries in the backend before showing the error; it does not replay the question from the browser after the stream has already been accepted. Each response shows a confidence badge and allows giving feedback (positive/negative) to improve the system. If you ask for deep RCA in chat, SPOT can propose an action to start an asynchronous RCA report and continue the investigation in the AI view.
The chat supports two response profiles:
Basis: technical answer with metric IDs, thresholds, instances, jobs, events, ML signals when available, and recommended SAP transactions.Business: impact, risk, and next-action summary for service owners, with less technical jargon.
SPOT does not run remediations from AI. Recommendations are investigation steps or console navigation.
Answers should follow the console or request language. SPOT keeps metric IDs, hosts, SAP transactions, and evidence IDs untranslated so you can cross-check them directly in Metrics, Events, Jobs, or SAP.
In SaaS, AI always works inside the authenticated tenant and selected SAP source. Reads use credentials scoped to that tenant/source, and reports, conversations, runs, traces, and evaluations are stored separately per tenant. AI cannot query another tenant or switch source because of an instruction typed in chat.
An administrator selects exactly one Primary provider. Other providers only take part in automatic recovery when they have an explicit Fallback priority; SPOT tries them in ascending order and skips disabled providers. An enabled provider without a priority can be tested manually but does not receive prompts as a fallback. The whole chain belongs to the same tenant and never uses global credentials.
Metrics and Operational Know-How
When you ask about a screen, an Operations domain, or a specific metric, AI can query the complete SPOT metrics catalog, not only the most common panels. The assistant uses the active SAP source, selected time window, and visible screen context to choose metrics, historical series, anomaly context, jobs, events, work-process snapshots, and SAP knowledge.
The catalog includes metric tooltip know-how when available: what each signal measures, how to interpret it, which thresholds apply, and which screens are useful for cross-checking. For example, a long-running WP question can combine the canonical long-running-work-processes series, its 24-hour maximum placement, and running-process snapshots with elapsed time.
If you ask for a chart, AI should return a chart built from real series retrieved by SPOT or an executable action to open it in Metrics. For known parameterized metrics, SPOT can query predefined safe variants; parameters never come from model-generated text. If no safe default exists, the query is omitted and the answer should mention that limitation.
Environment Knowledge Base
Only administrators can list, open, add, approve, archive, or delete notes, Markdown, TXT, or PDF documents associated with the active SAP source. Documents start as drafts and only take part in answers after approval; viewers only receive answers and evidence retrieved from approved content. SPOT keeps provenance, version, language, validity, and confidence so the origin of a recommendation can be reviewed.
SPOT retrieves both product SAP knowledge and approved environment documents by relevance. Packaged knowledge is read-only and remains separate from your environment content. A historical RCA becomes a reusable pattern only after an administrator confirms its outcome and cause. In SaaS, documents and patterns remain isolated by workspace and SAP source.
AI, Baselines, and Thresholds
When SaaS or on-prem ML data is available, AI can use Expected range, Forecast, and Anomaly score as weighted evidence alongside thresholds, Events, Jobs, work-process snapshots, and Operations domains. Do not read that evidence as a single root cause: a statistical anomaly means the value moved away from its normal pattern, but you still need to check whether it matches a job, event, degraded instance, or operational change.
If ML does not yet have a model for a metric, AI treats that as context (warming_up, no_model, or unavailable) and continues with the remaining evidence. Missing ML does not mean the system is healthy and does not mean AI has failed.
For a complete investigation:
- Open Metrics and inspect the tooltip with real value, expected mean, expected min/max, forecast, and score.
- Check the affected Operations domain for OK/WARN/KO.
- Cross-check Events and Jobs in the same time window.
- Use Machine Learning to interpret states such as
ready,warming_up, orno_matching_series.