07 Availability
Availability answers whether SAP instances are available and whether degradation affects part of the landscape.
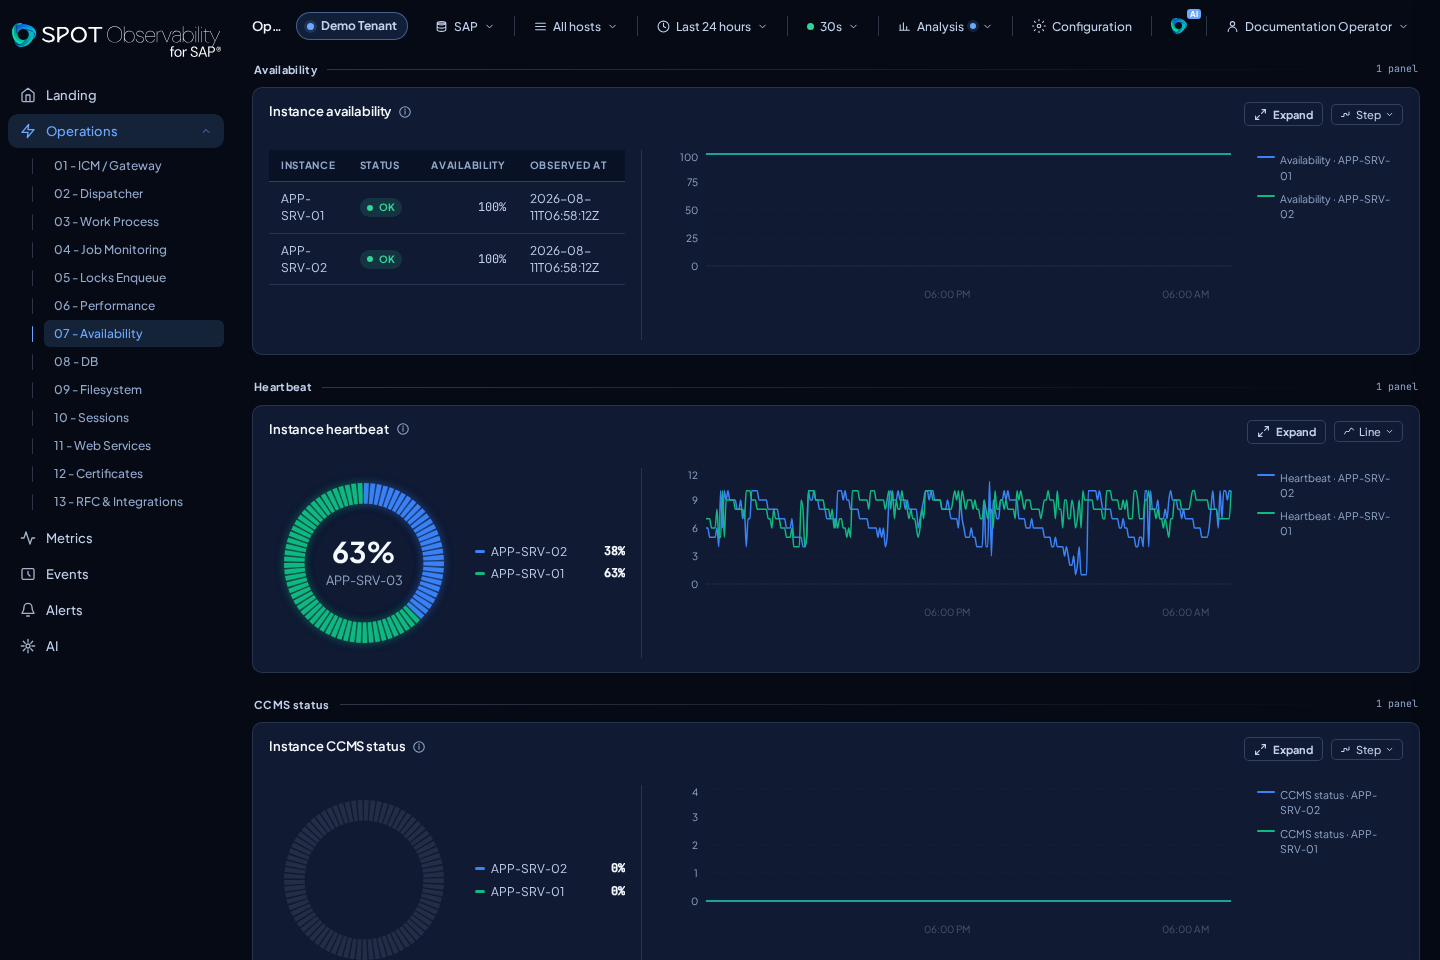
What appears
- Instance availability: current status table and trend in a 4/8 ratio.
- Instance heartbeat: current distribution and timeline in a 4/8 ratio.
- CCMS instance status: current distribution and step history in a 4/8 ratio.
Each pair shares context and filters while preserving the identity of all its
series. If one part is UNKNOWN, the other remains visible and the panel
reports a partial state.
These signals describe state and freshness rather than a trainable continuous value. They therefore show no Expected range, Forecast, or ML score controls or messages, including in expanded charts.
How to interpret it
- OK: instances are available and reporting within the expected window.
- WARN: the signal is intermittent, delayed, or only part of the landscape is degraded.
- KO: an instance is unavailable, has stopped reporting, or no recent data exists for the selected target and host.
Treat missing recent data carefully. A KO state can mean a real SAP instance issue, but it can also mean the connector stopped sending data, the selected SAP source is wrong, or the time range does not include the latest samples.
Filters and next screens
Start with all hosts to see whether the issue is global. If only one instance is affected, filter by that host and open the Landing map to inspect the node in context. Use Events to look for system messages around the first unavailable minute, and Performance to check whether CPU, memory, or DB latency degraded before the availability signal changed.