05 Locks Enqueue
Locks Enqueue explains whether degradation comes from saturation or lock waits. Landing retains basic health through Enqueue lock count and Enqueue server availability; this domain provides detailed diagnostics.
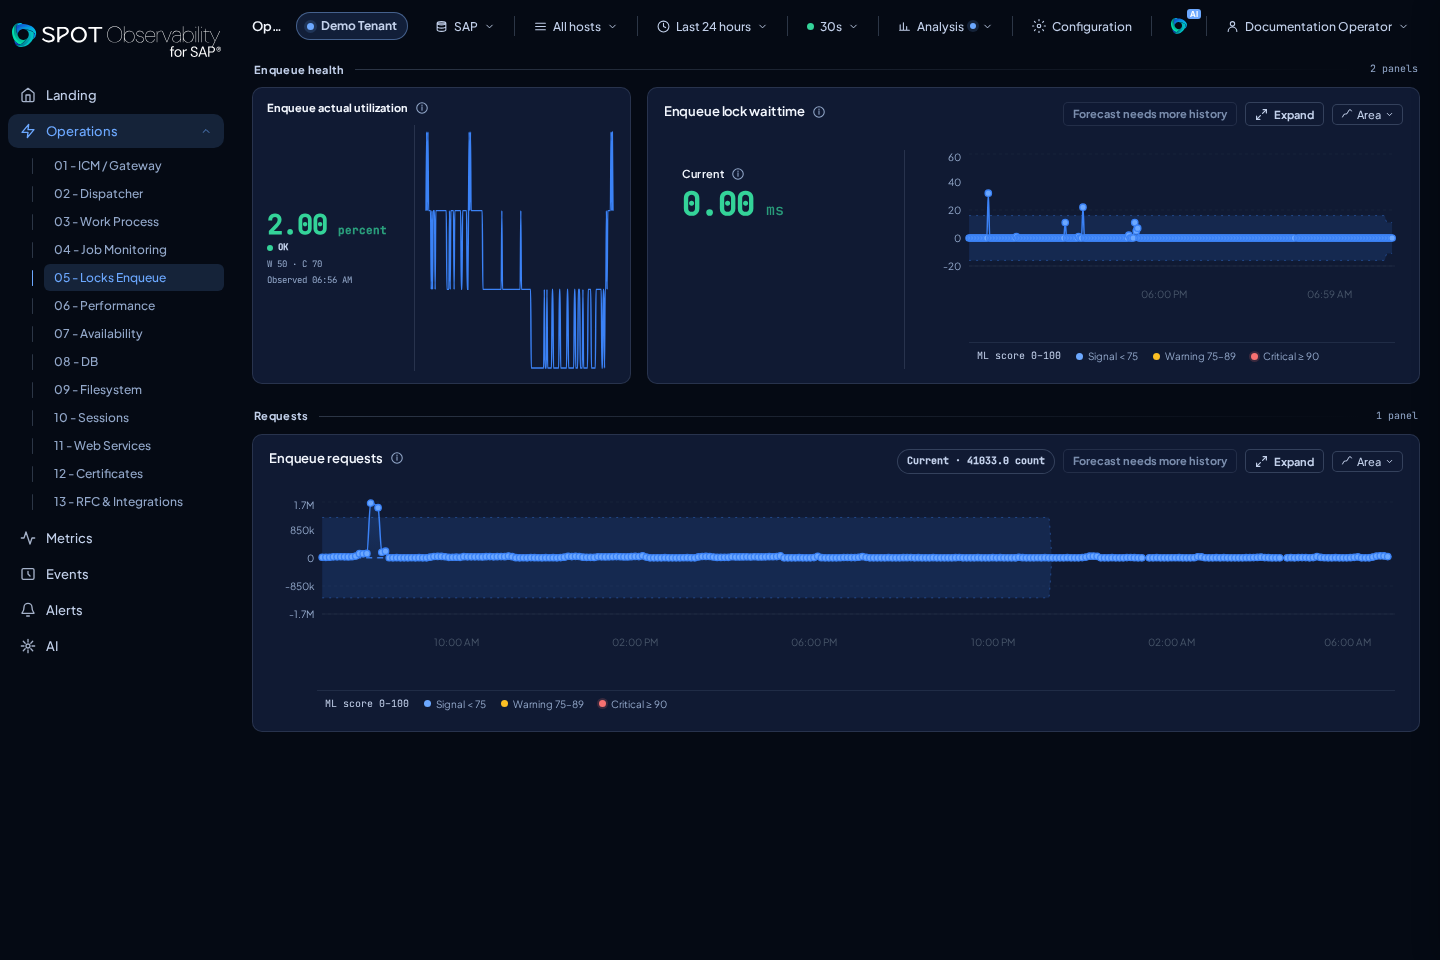
What appears
| Panel | metricId | Reading |
|---|---|---|
| Enqueue actual utilization | enqueue-owner-utilisation | Current enqueue server utilization and recent microtrend |
| Enqueue lock wait time | enqueue-lock-wait-time | One panel with the current state and trend |
| Enqueue requests | enqueue-requests | Enqueue requests and their full-width trend |
enqueue-lock-time, historical enqueue-lock-count, and historical enqueue-server-availability remain available in Metric Explorer, but do not appear as panels in this domain.
Enqueue actual utilization uses one third of the first row and combines value, state, thresholds, freshness, and a microtrend, while the current+trend composition for Enqueue lock wait time uses the remaining two thirds. A member without data does not hide a valid member and is not replaced with zero.
How to interpret it
- OK: utilization and wait match the workload without sustained growth.
- WARN: utilization is high, requests grow, or wait recurs.
- KO: wait time is sustained, blocking has operational impact, or Landing confirms enqueue unavailability.
UNKNOWN: no sufficiently recent sample exists; it does not mean zero wait.
Request growth matters when it aligns with user complaints, job delays, or update pressure. A short peak can be normal during heavy activity, but wait time should recover when the activity ends.
Filters and next screens
Cross-check Events for enqueue messages, Jobs when the wait overlaps batch processing, Work Process when locks stop execution, and Landing when server availability changes. Use Metrics to widen the series or inspect signals available only in Explorer.