03 Work Process
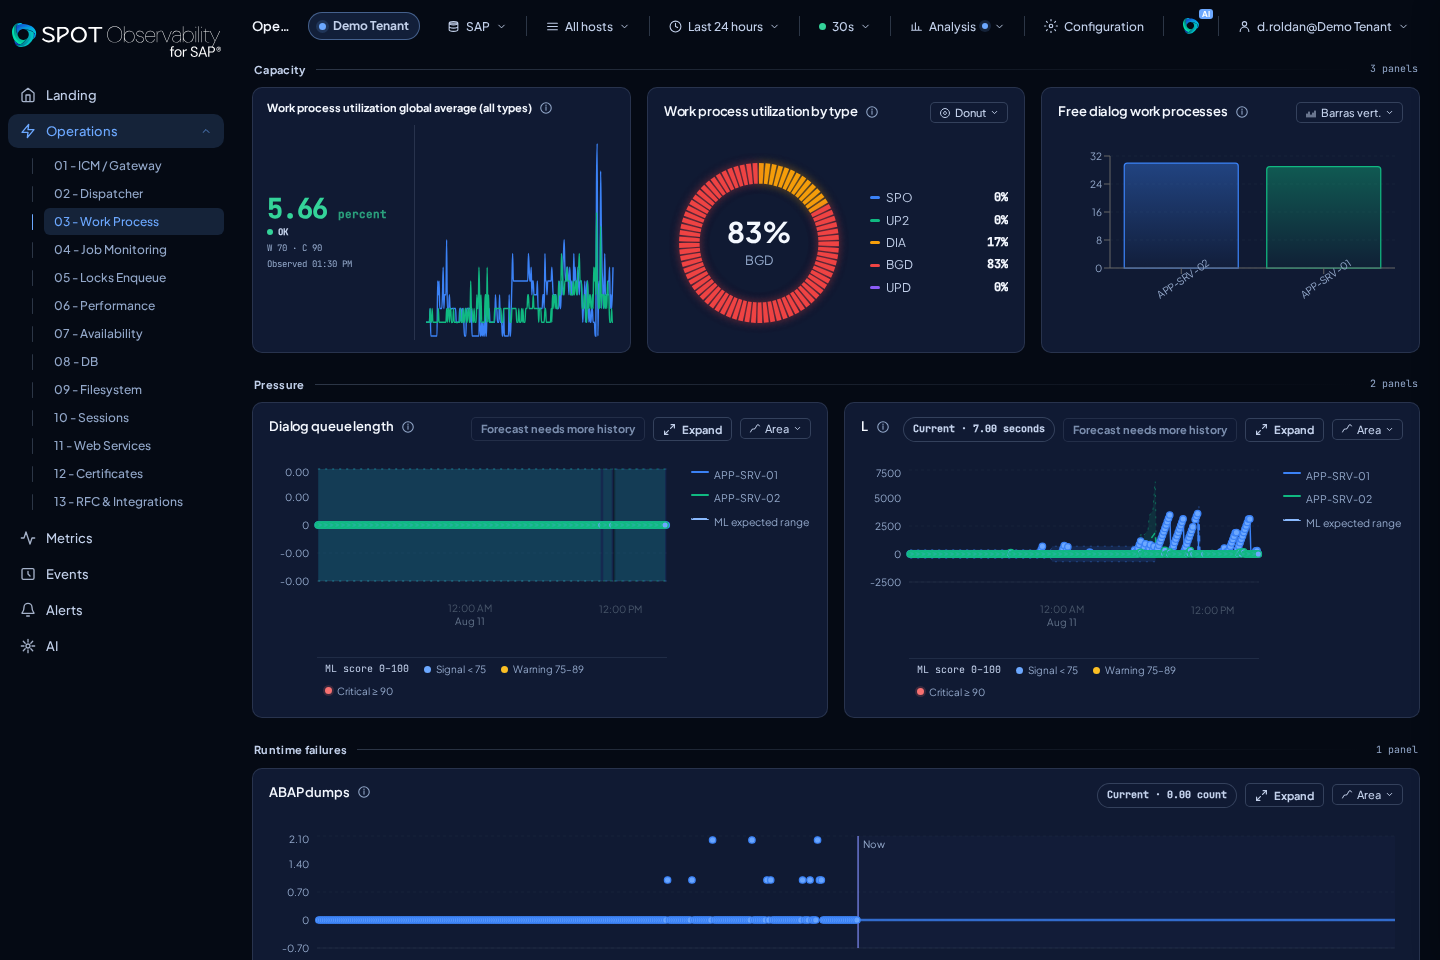
Work Process shows whether SAP has execution capacity, how active work is distributed by type, and whether dumps or long executions appear.
What appears
| Panel | metricId | Reading |
|---|---|---|
| Work process utilization global average (all types) | work-process-utilisation-global | Current value, thresholds, freshness, and microtrend of busy processes over all active processes |
| Work process utilization by type | work-process-utilisation-by-type | Share of DIA, BAT/BGD, UPD, and other types among busy processes |
| Free dialog work processes | free-dialog-wps | DIA processes in Waiting or Standby state |
| Dialog queue length | dialog-queue-length | Trend of dialog requests waiting for processing |
| ABAP dumps | abap-dumps | Dumps recorded in the selected range |
| Long-running work processes | long-running-work-processes | Current CCMS duration in seconds and its trend |
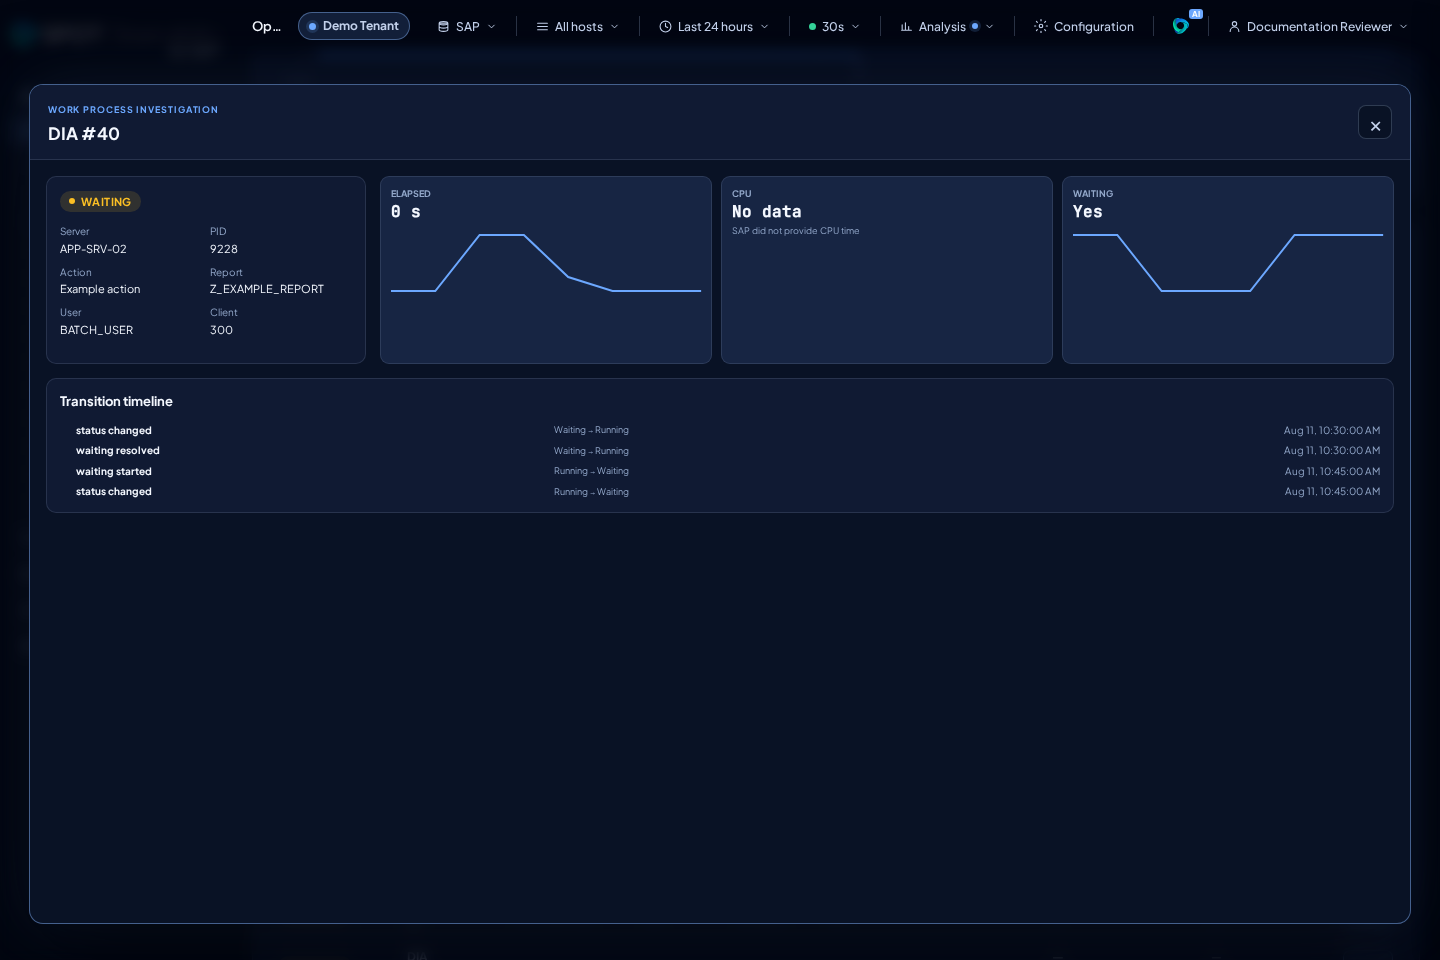
Below the metrics, Work process activity shows the latest snapshot for each process: state, type, server, elapsed time, CPU, waiting, action, report, user, and client. Select a row for the summary or open the detail to inspect trends and waiting, dump, restart, or 120-minute threshold transitions.
The timeline also marks context changed when action, report, user, or client changes between polls. Each card shows only the fields that changed, as previous → current. These are changes observed between polls, not necessarily every internal SAP change in that interval. A context change can occur beside state, waiting, restart, dump, or long-running evidence; SPOT keeps those milestones as separate entries.
The view opens filtered to Running, while counters and selectors always
cover the complete source/host/range. Status cards show Running, Waiting,
On Hold, and any additional SAP state. Selecting a card filters the table;
selecting it again removes the filter.
CPU and waiting are trustworthy only for measurement-v2 snapshots. CPU is
shown in seconds when SAP supplies it; 0 is a real value and No data means
absence rather than zero. Waiting is shown as Yes/No and may include the SAP
reason (ADM, RFC, ENQ, and others) plus its local start time. That clock
value is never converted into a duration. The first observation seeds the
process without creating an artificial transition.
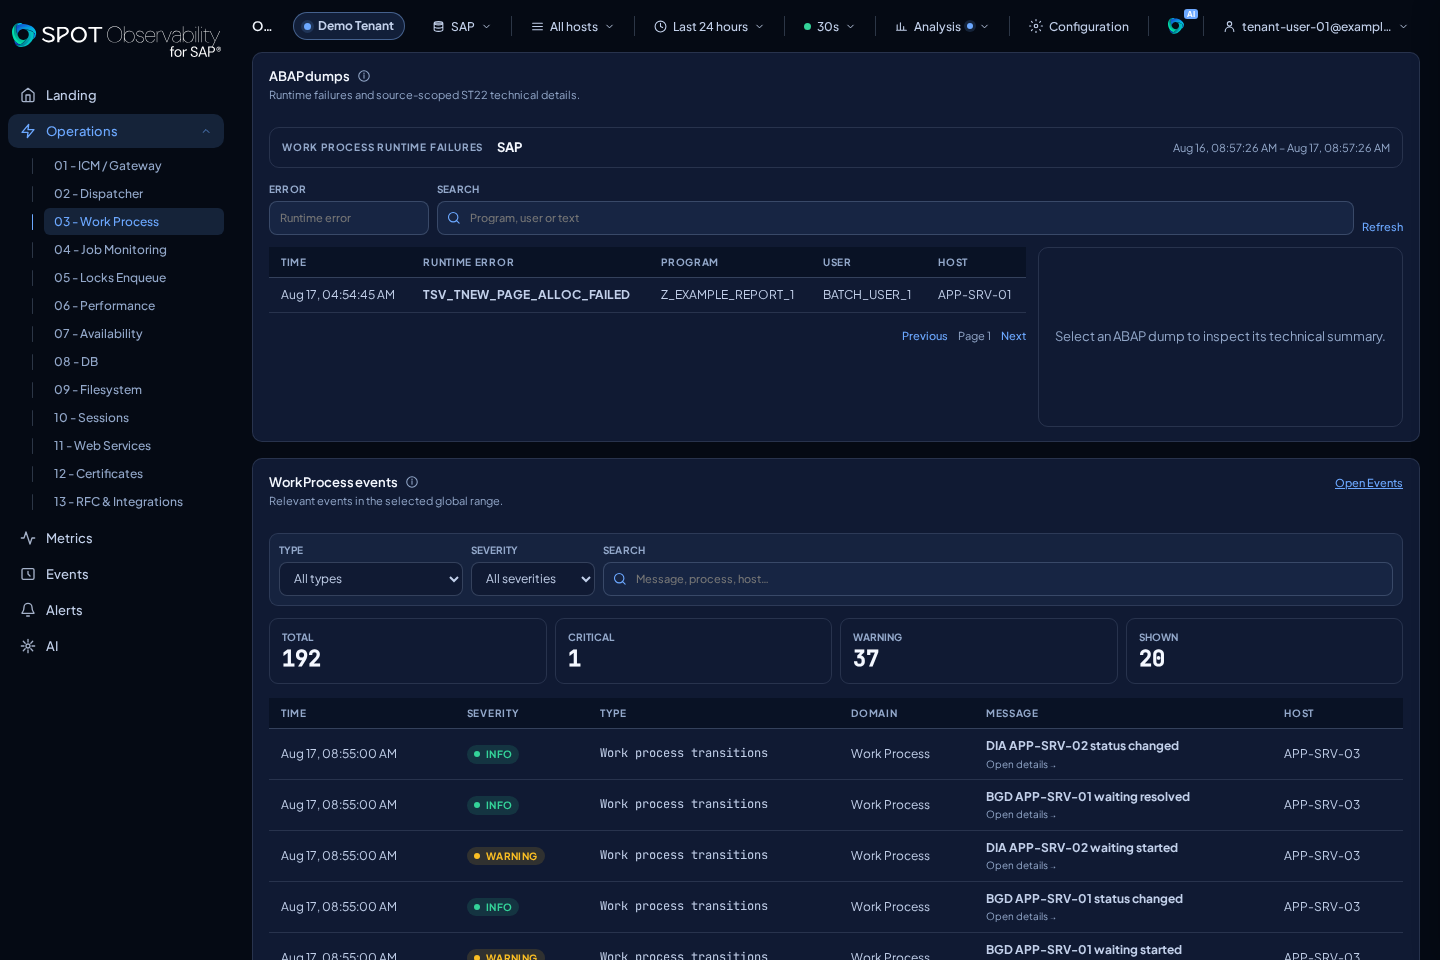
Work Process events reuses the global range, source, and host. Filter by type, severity, and text without leaving the domain; events link to a process when they contain its canonical identity.
ABAP dumps also belongs exclusively to Work Process. Its paged table can be
filtered by error, program, user, and text. Selecting a row loads Dump
summary and the Runtime error description; Open details opens the
investigation as a blue primary action that remains visible in light and dark
themes. This description comes from the SNAPT catalog and is generic to the
runtime error identifier; it is not the long text or instance detail shown by
ST22. Events and AI deep links target this view. Job Monitoring has no dump
routes, tabs, or aliases.
Description status distinguishes an available description (complete), a
valid read without text (empty), missing authorization (unauthorized),
temporary unavailability (unavailable), a response that could not be decoded
safely (unsupported), and a document from an earlier connector without a
usable description (legacy_missing). A state other than complete does not
mean the dump did not occur. Open the instance in ST22 when you need its full
detail.
To collect Dumps, the SAP technical user must be allowed to execute
DDIF_FIELDINFO_GET for SNAP_BEG and receive DFIES_TAB with fields marked
by KEYFLAG. SPOT checks that metadata again on every collection. If the
permission is missing or SAP returns no key fields, collection fails closed; it
does not fall back to the incomplete historical identity. The current identity
keeps key fields that distinguish occurrences and, when exposed by the
descriptor, user and session. legacy_dump_id only links earlier data; it does
not merge distinct current dumps.
The SNAPT catalog lookup remains separate enrichment. If that read is not
authorized or unavailable, SPOT keeps the valid dump header, leaves the
description empty, and exposes the corresponding explicit status. It never
substitutes invented description text.
Global utilization and utilization by type answer different questions. Global utilization is calculated per instance as busy / active × 100 and is aggregated with weighting. Distribution by type uses only busy processes as its denominator; it does not represent total capacity utilization for each type. Stopped and unknown states are excluded.
long-running-work-processes reports a duration in seconds per server; it is
not a process count.
The first row compares global capacity, distribution by type, and free DIA processes in three equal panels. The next row places queue pressure and long executions in two equal halves. ABAP dumps retains its series and shows the current summary in the same panel header.
How to interpret it
- OK: free DIA processes remain available, global utilization is stable, and no relevant long executions appear.
- WARN: few DIA processes are free, queue length grows, or long-running work processes repeat.
- KO: active capacity is exhausted, queueing is sustained, or dumps have operational impact.
UNKNOWN: no fresh sample exists; an older historical point is not reused as the current value.
Work Process helps decide whether users are waiting because SAP has no capacity left to execute their work. A high BAT/BGD share means that type dominates busy processes, not that all of its capacity is exhausted. Combine it with Dispatcher queues: queue growth plus low free dialog work processes is much stronger evidence than either signal alone.
Filters and next screens
Cross-check Jobs when batch dominates, Dispatcher when queues grow, Performance when dialog response rises, and Events when dumps or SAP messages appear around the peak. Use Metrics to compare global utilization with a specific type series.