04 Job Monitoring
Job Monitoring first answers whether the work was completed, then helps locate where and when batch impact is concentrated.
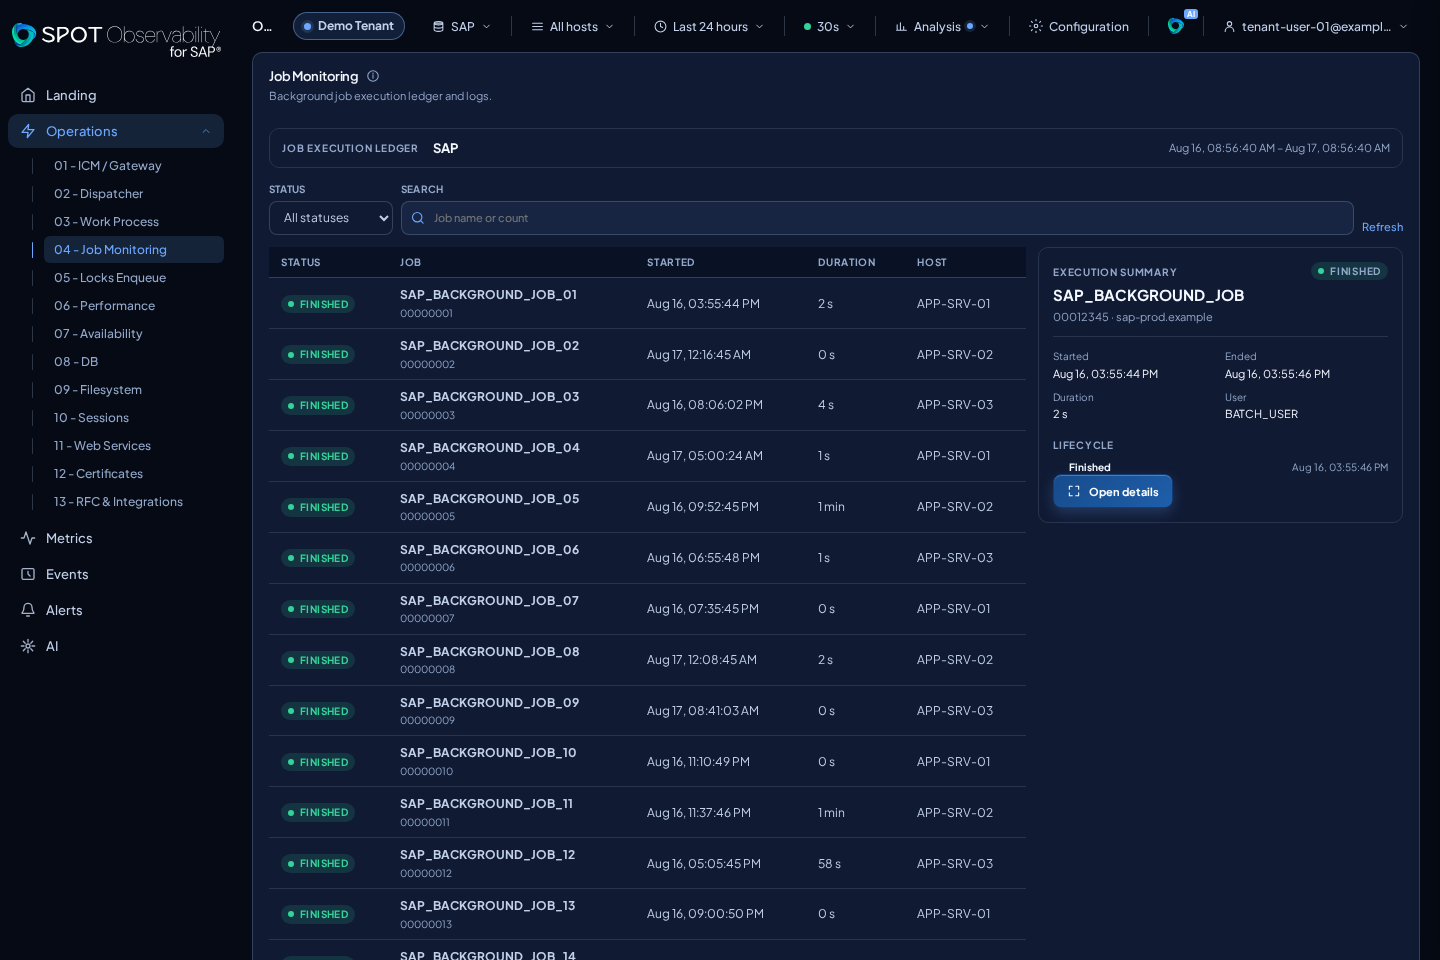
What appears
| Panel | metricId or dataset | Reading |
|---|---|---|
| Failed jobs · Last 15 min | failed-jobs | Batch-error increments during the 15 minutes before the selected range end |
| Canceled jobs · Last 15 min | canceled-jobs | Unique canceled executions during the 15 minutes before the selected range end |
| Long-running jobs · Current · >120 min | long-running-jobs | Current snapshot of jobs running for more than 120 minutes |
| Long-running work processes by server | long-running-work-processes | CCMS duration in seconds, separated by server |
| Maximum long-running work processes (24 h) | long-running-work-processes | Real maximum duration over 24 hours by server; the donut contains only real servers |
| Background work processes | job-metrics | NumberOfWpBTC capacity by server as a stepped line |
| Background work-process errors | failed-jobs | ErrorsInWpBTC increments by server as bars |
| Job families | Jobs | Exact SAP-name families with activity in the selected range |
| Job Runs | Jobs | Executions within a family and their detail |
| Job Events | Events | Job-related events |
Failed jobs does not expose the cumulative SAP ErrorsInWpBTC counter
directly. SPOT deduplicates each observation by TID and calculates positive
increments per server. After a counter reset, the new value is the increment;
when there is no recent predecessor or the gap exceeds 15 minutes, the result
is UNKNOWN. Zero is shown only when valid coverage exists.
Canceled jobs counts unique job_run executions with SAP state A in
(to-15m, to]; it does not depend on Job Log. Failed jobs uses the same
range end: its KPI represents that rolling window, while its chart retains the
complete selected range. The terminal timestamp and server come from the
authoritative execution itself.
Long-running jobs uses per-server XBP snapshots. The connector selects SAP
jobs in state R and counts only those running for strictly more than
120 minutes: exactly 120:00 is excluded and 120:01 is included. A fresh zero is
a valid observation; UNKNOWN means missing data, an error, or lost freshness.
SPOT does not substitute Work Process data, demo data, or an invented zero.
When SAP represents a valid selection with no results, SPOT publishes zero
only after validating both the return code and a present, empty result table.
Every other response remains UNKNOWN: a general SAP error is never converted
into zero.
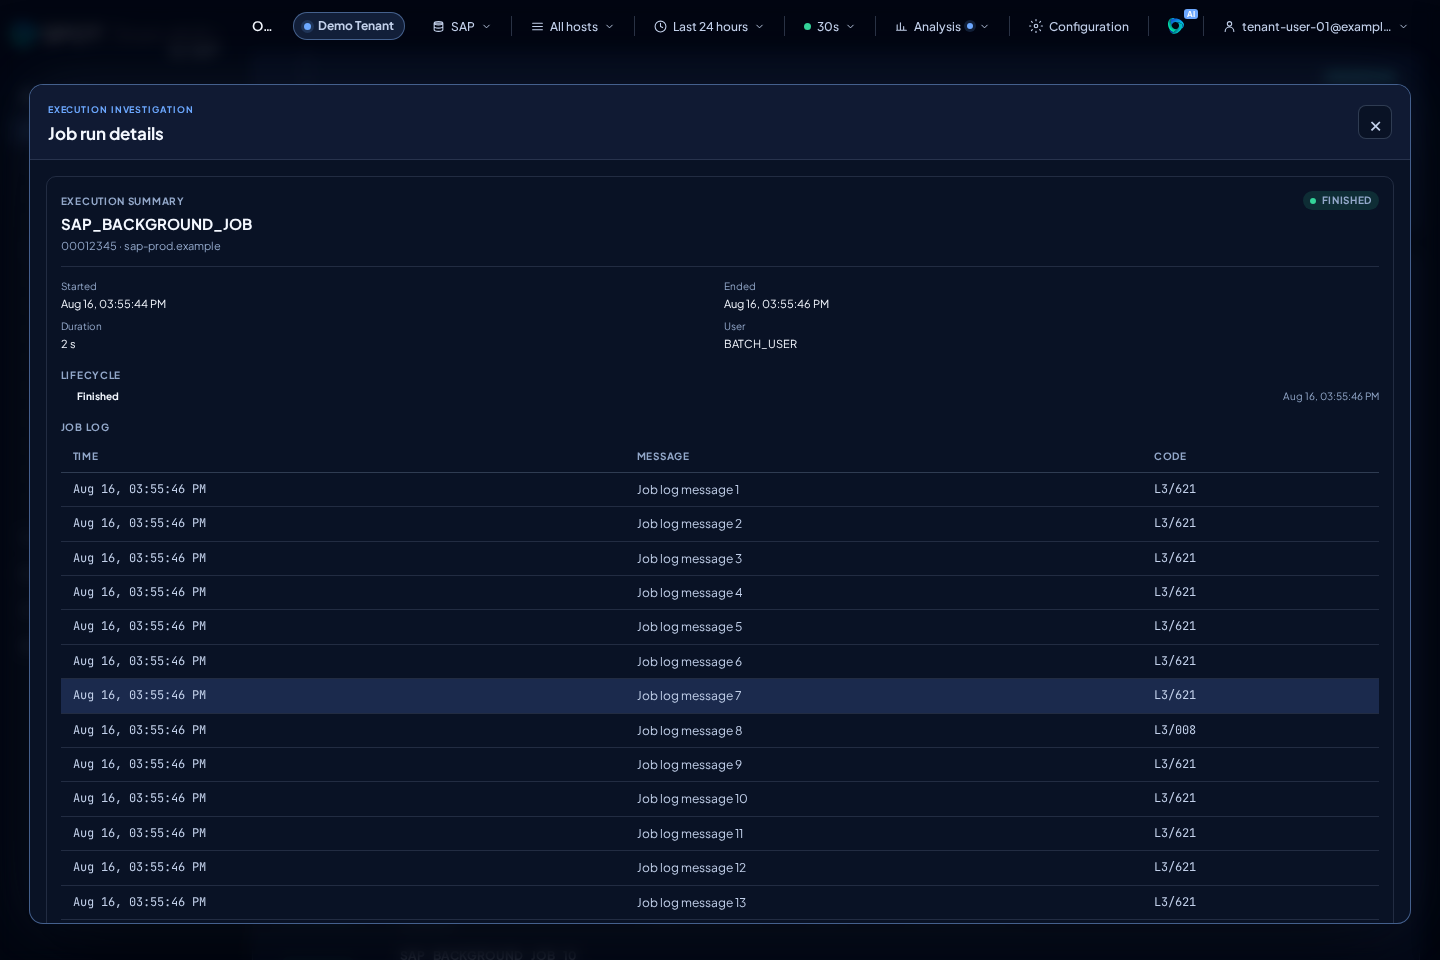
SPOT collects the complete Job Log for a terminal execution asynchronously. The log queue does not stop later job observations. In the detail, the manifest shows Queued, Collecting, Retrying, Complete, No entries, Too large, Not authorized, Unavailable, or Collection failed. SPOT never presents a partial log as complete: it waits until lines are confirmed before marking it Complete. If a log is too large or SAP does not provide it, the execution, lifecycle, and the rest of the investigation remain available.
Long-running work processes is a duration signal in seconds, not a process count and not a substitute for running jobs.
The three functional outcomes appear as equivalent KPIs. The
Long-running work processes detail shares a composition with its 24-hour
maximum in an 8/4 ratio. The Background processing by server composition
keeps two separate synchronized charts: NumberOfWpBTC capacity above and
error deltas below. They share a time cursor, legend, and server colors, while
using independent integer axes from zero. When every covered delta is zero, the
panel explicitly reports that no errors occurred; an UNKNOWN bucket prevents
that message. Job Runs and Job Events keep their own panels; dumps are
investigated exclusively in Work Process.
In Job families, each row is an exact JOBNAME: an operational family for
investigation, not an immutable SAP scheduler definition. Separate columns
show status and last activity alongside the latest
execution's duration (Last run time). A real zero duration appears as 0 s; if that execution has no valid duration, the value is —. Selecting a family
opens its dedicated full-width workspace with the active source, host filter,
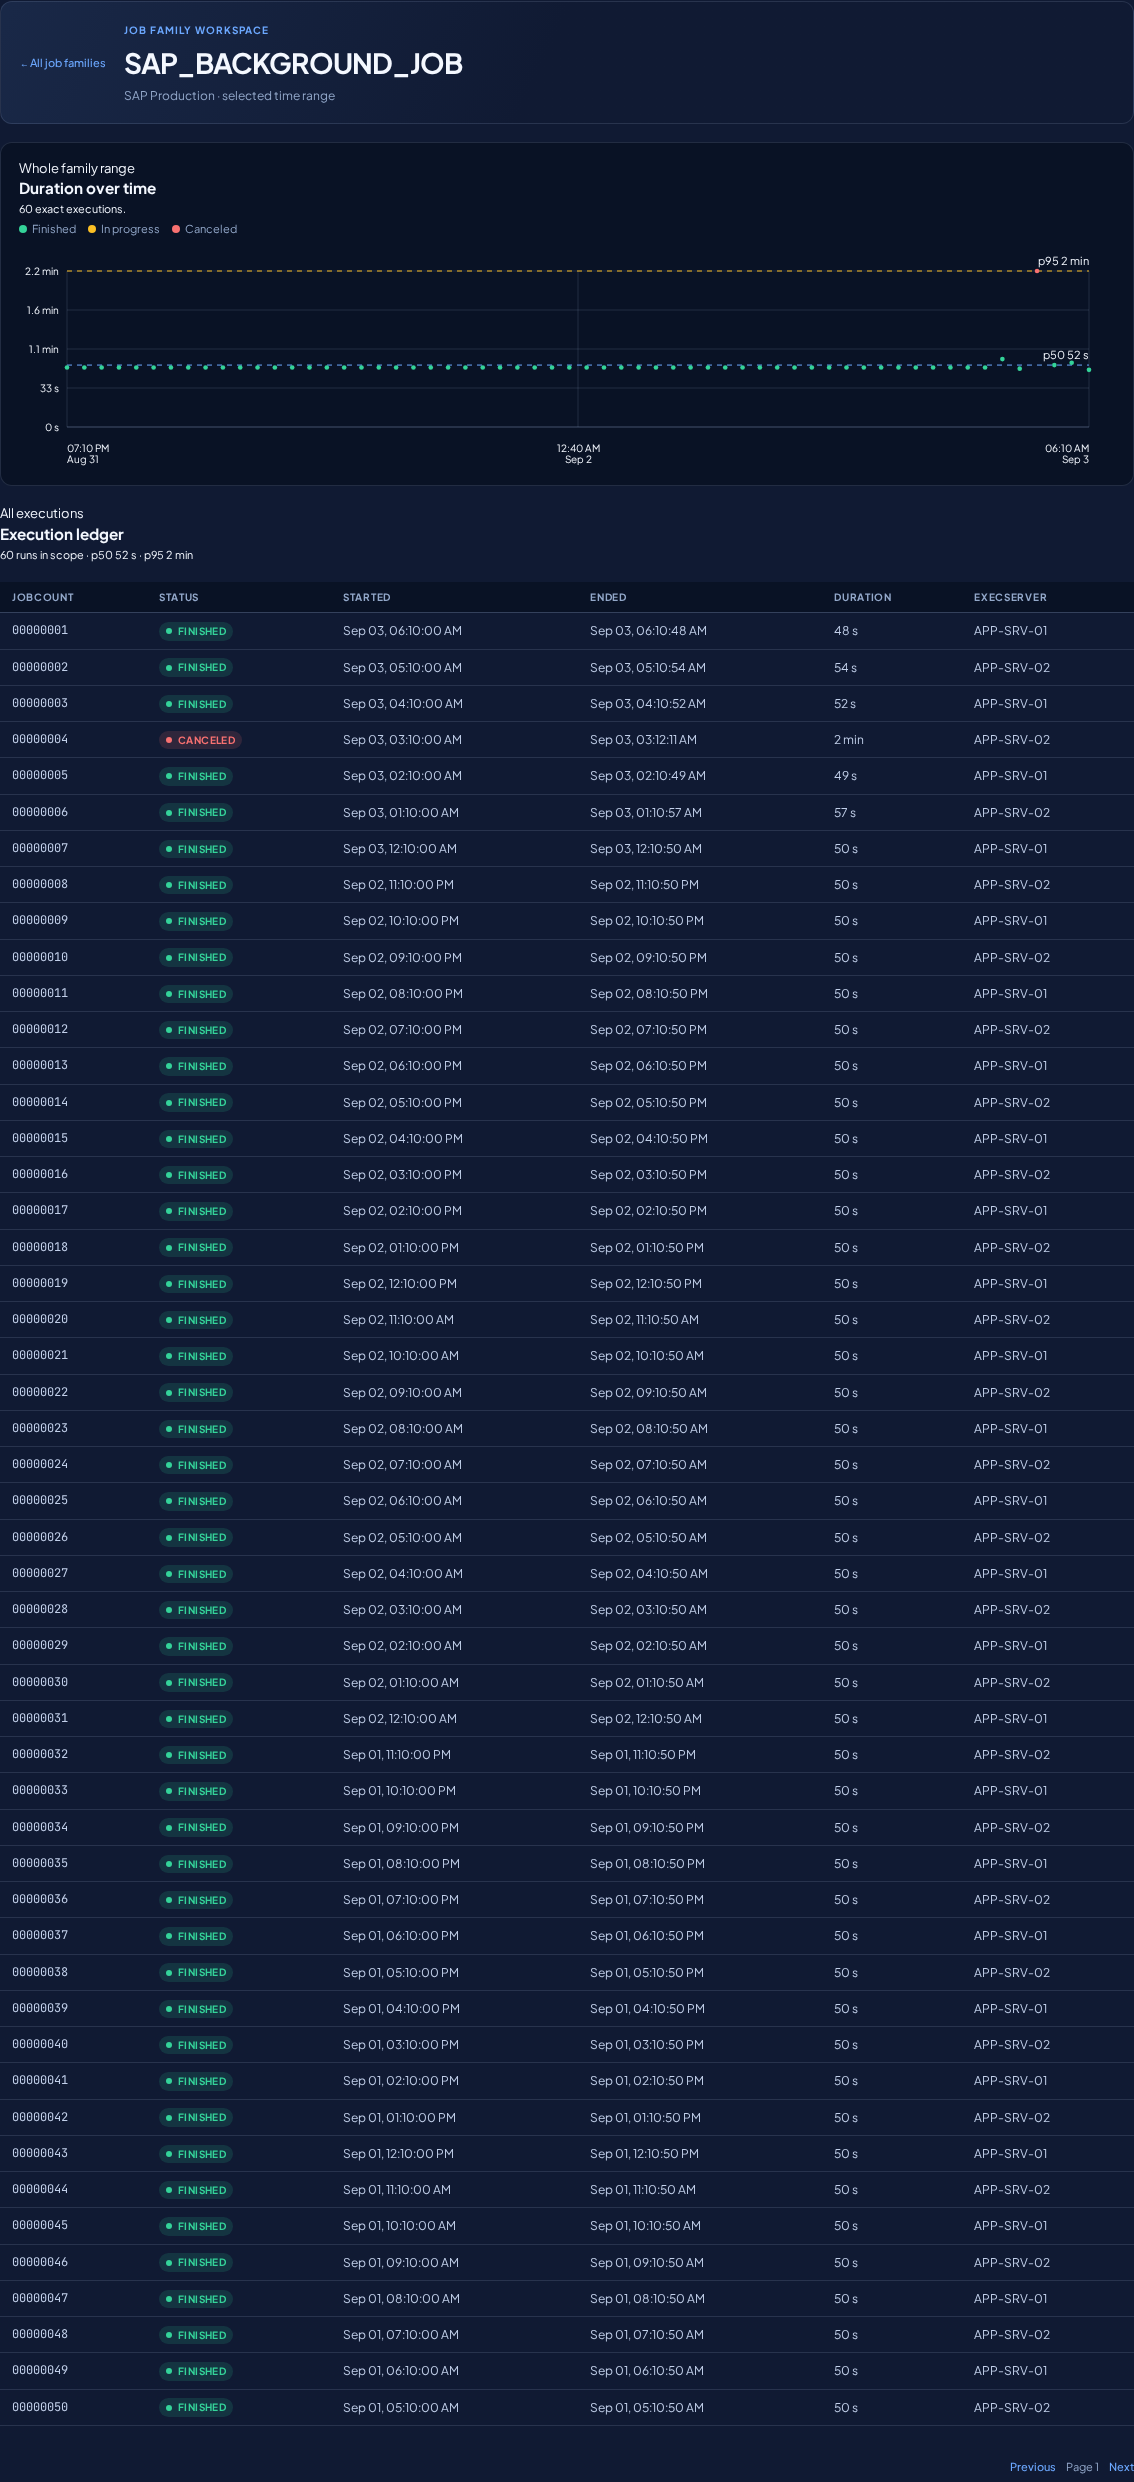
and time range. The duration chronology covers the complete scoped family,
independently of the paginated ledger. With up to 1,000 executions it shows
every exact point; for larger families it summarizes time intervals while
retaining real minimum, maximum, and representative executions plus status
counts. The ledger remains the exhaustive paginated view and keeps the SAP
identity JOBNAME + JOBCOUNT, status, start, end, duration, and
EXECSERVER. Unknown durations remain unknown and are never converted to
zero. As point density rises, visible marks shrink gradually while their hit
area and keyboard or pointer highlight remain accessible.
Select a JOBCOUNT or an exact chart point to open the execution detail
directly. Its summary remains visible at all times, with only two tabs: Job
Log, selected on open, and Retained history. Escape closes it and returns
focus to the invoking control. Use All job families to return to the list
with its filters, page, and reading position intact.
Selection and retained evidence
The global range, selected SAP connection, the source it represents, and the host filter determine whether an execution can be selected. Once SPOT validates the execution in that context, it retrieves its complete retained lifecycle, manifest state, and Job Log, even if those records were collected outside the visible time window. This retrieval never broadens scope: it always keeps the same connection/source, tenant, and host.
A family's host summary covers the complete family within the selected range,
not just the runs on the current ledger page. SAP names are handled as exact
names; you can search for a family whose name uses punctuation, such as +.
A shared link can contain both a family and an execution. If that execution belongs to another family or is no longer available in the active context, SPOT keeps the family, clears only the execution, and never shows another family's Job Log. Select an execution from the table to continue the investigation.
How to interpret it
- OK: there are no relevant failures or cancellations in the observed interval.
- WARN: failures repeat, cancellations grow, or batch pressure concentrates on one server.
- KO: impact on critical work is sustained, or job degradation coincides with batch-capacity degradation.
UNKNOWN: a fresh signal is missing. For Long-running jobs, check XBP permissions, the connection time zone, and Agent logs.
A 0 in Canceled jobs is valid when the interval was observed with no
cancellations through a successful query. If the logs Data Stream is not
available or the producer is not schema v2, the result is UNKNOWN or
producer_upgrade_required, not zero. In Long-running
jobs, 0 is also valid, but only when it comes from a successful XBP
snapshot. The same canceled execution is deduplicated by job_run identity.
Filters and next screens
Filter by global range, text or exact name, status, and host. Start with a
family, then compare the JOBCOUNT values across hosts and open an execution
that diverges from p50/p95. If the manifest is not Complete, check its
state before deciding that there were no messages. Use Job Events for current
related messages. Cross-check Work Process for batch capacity and dumps, DB for
latency, and Filesystem when the job writes spool or exports.
Operational use
Job Monitoring summarizes the batch outcome without requiring you to open the full table first. The three functional KPIs also appear on Landing; the remaining panels provide per-server detail and history.
For repeated failures, cancellations, or slow executions by job name, open the family and compare each execution and its events. If they coincide with high DB request time or missing batch processes, cross-check DB and Work Process before attributing the issue only to the job.