Programs
Programs answers two questions: which SAP code consumed the most time in
the selected window, and which individual execution should be investigated.
It uses standard ABAP workload statistics read through
SWNC_GET_STATRECS_FRAME; it does not estimate executions from Work Process
polls.
Start with the ranking
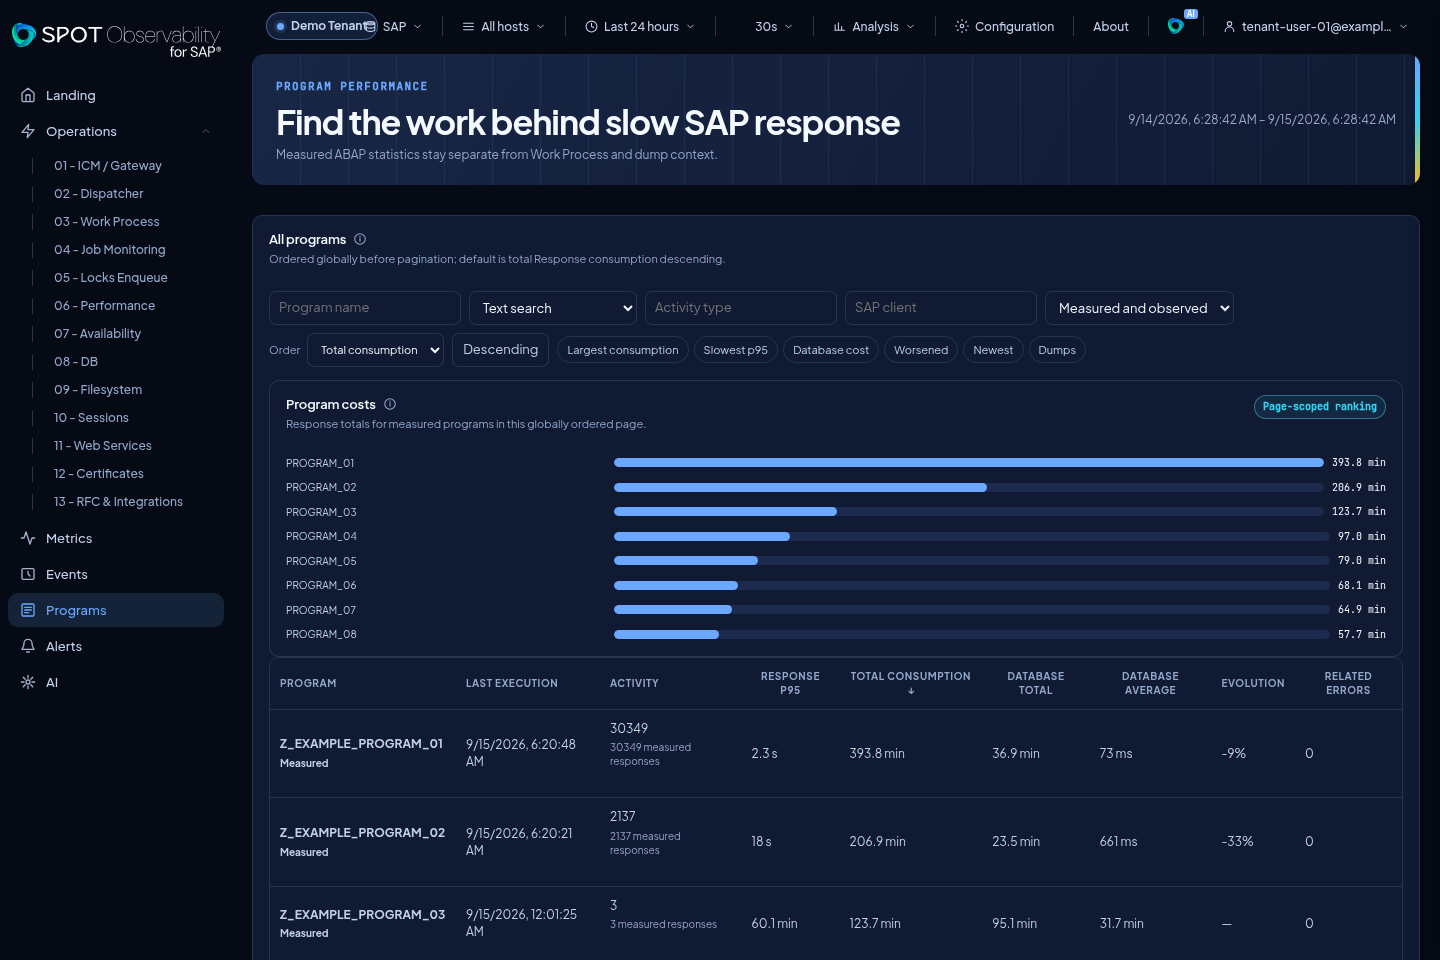
Select a SAP system, time range, and, when needed, host in the global bar. The initial list is ordered by Total response consumption, highest first. This puts programs with the largest accumulated cost at the top even when no single execution is the slowest one.
The visible Order selector supports latest execution, execution count, p95 response, total response consumption, total or average database time, evolution, and related dumps. You can reverse any of them with the ascending or descending direction; SPOT applies both order and direction to the complete result on the server. The investigation shortcuts start with:
- largest accumulated consumption;
- slowest p95;
- highest database cost;
- programs that worsened against the equivalent previous period;
- newest activity;
- programs with related dumps.
Every shortcut selects a concrete catalog order. Search is textual over the SAP program name; the exact name remains the program identity. Client and activity type are retained as execution dimensions, not different program identities.
The backend always orders the complete filtered result before pagination and uses the exact name as a stable tie-breaker. Next therefore continues the same global order; the UI does not reorder only the visible items. To keep that response stable for high-volume ranges, SPOT computes bounded per-program summaries instead of transferring every execution to assemble the catalog. Filters, ordering, and pagination retain the same global scope.
Read the measurements
| Signal | How to read it |
|---|---|
| Response | Total time of the SAP statistics record. |
| CPU | Independent CPU time; it is not added to Response as another component. |
| Database | Time observed from the application server database interface. It is neither a SQL trace nor pure database-engine time. |
| Wait | Wait time supplied by SAP in the record. |
| Load | Load/generation time recorded by SAP. It appears only when all required components or an explicit legacy load value are present; it is not ABAP processing time. |
SPOT converts supported raw SAP timings uniformly from microseconds to seconds; the UI uses milliseconds below one second. A newly collected execution shows CPU, Wait, and Load only when its timing provenance is verified. For historical records without recognized provenance, SPOT retains valid Response and Database, omits those three components, marks Partial timing, and displays a notice. It does not guess a unit from magnitude, backfill history, or present ABAP processing as a new measurement.
An unavailable value remains unknown; it is never converted to zero. p50, p95, averages, and comparisons use only executions with valid measurements and show their sample size. Evolution compares two equal-duration windows with the same filters; SPOT shows a direction only when both contain at least 20 valid samples.
A program can appear as Observed only when SPOT has seen it in Work Process or a dump but has no measured statistics execution yet. Observed context counts those observations, not executions. The latest observation keeps its own time and host, separate from Last execution. Execution count stays at zero, timings remain unknown, and no synthetic duration series is drawn. Measured means main timings are available; Partial timing means one or more measures are missing.
Open a program and an execution
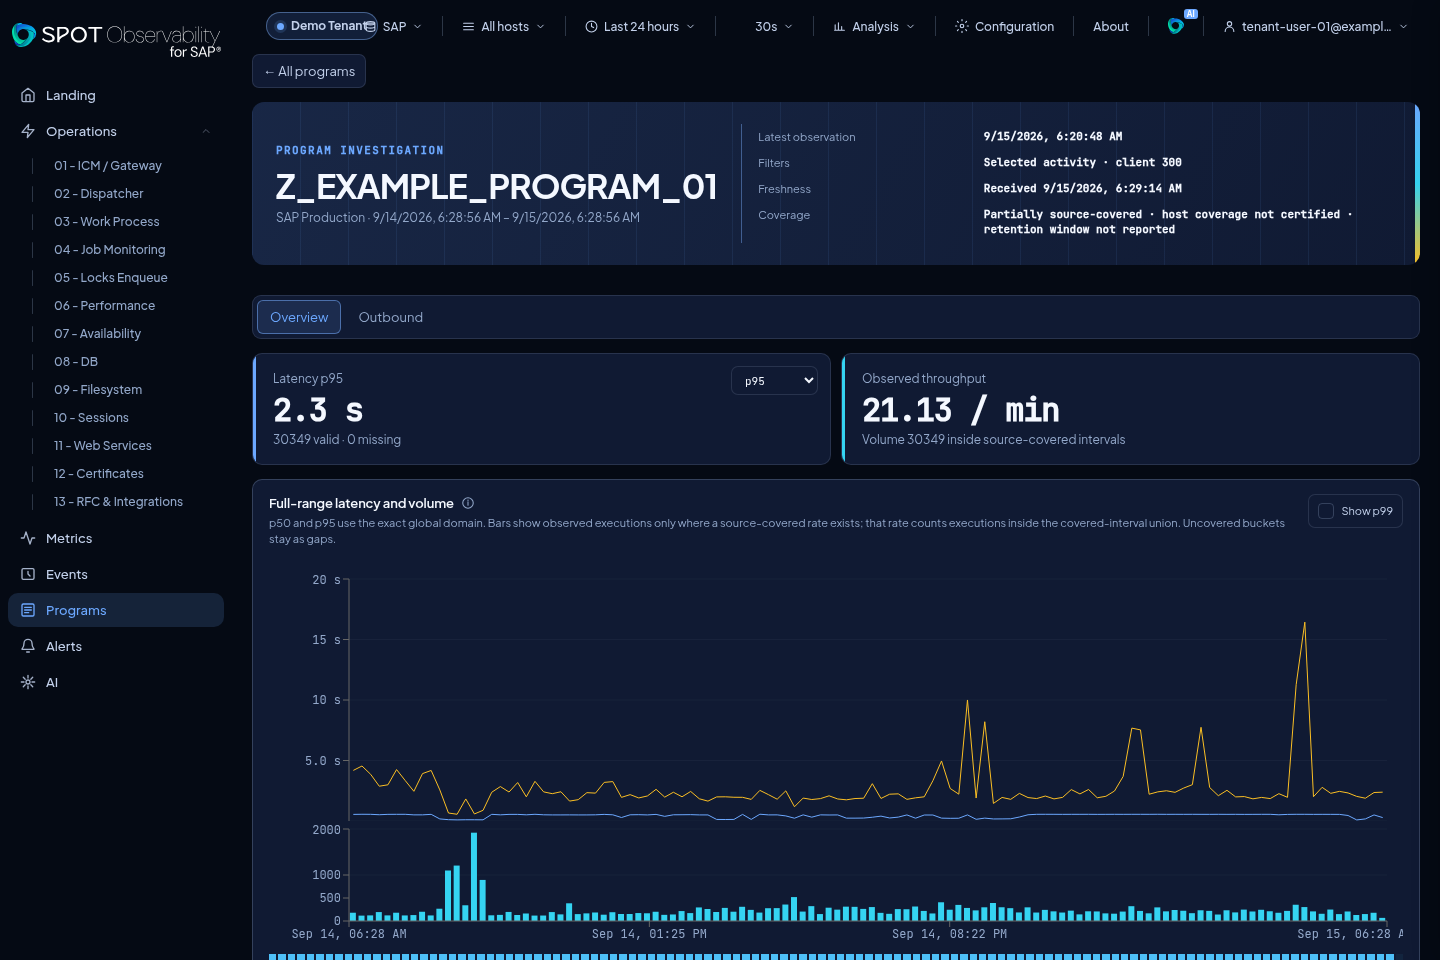
The investigation uses the whole selected range. Choose average, p50, p95 (the default) or p99 in the single latency KPI selector. p50/p95 and optional p99 use the real time axis above a separate aligned volume band; selecting a time bucket applies it to the global range. Observed throughput counts only executions inside the union of source-declared covered intervals. Gaps remain gaps; this is not a retention or per-host completeness certificate, and unknown throughput is not displayed as zero.
The latency histogram covers every valid Response in the range: 30 bins, linear/log scale, numeric bounds and direct range selection. Zero and missing measurements are explicit, and p50/p95/p99 markers do not manufacture values. All, ≥p95, ≥p99 and [p95,p99) cohorts show actual bounds and counts.
Representative samples select 20, 50 (default) or 100 executions across the whole population. Recent samples are filtered and paged; neither choice changes KPIs. Open a selected execution and use Previous/Next, Jobs, Work Processes or Dumps without losing global context. Response, Database, Wait and Load are independent mean trends with their own counts; CPU is separate and Database is the application-server DB interface, not an SQL trace.
Select a row to replace the ranking with a full-width program workspace. Review its evolution, hosts, activity, and recent executions. Open an execution for timings, Job context when present, and evidence coverage. Back restores the same sort, filters, page, position, and focus; the link can be shared without losing the selection.
Catalog costs compares programs on the visible page. It helps select the next candidate, but neither replaces global ordering nor claims to show the complete catalog.
Use cross-navigation according to the question:
- Jobs: background steps, status, and Job Log for the selected execution.
- Work Process: capacity and infrastructure around the time window.
- Dumps: temporally related ABAP errors.
- DB and Metrics: database and infrastructure pressure in the same range.
Dependencies and related context
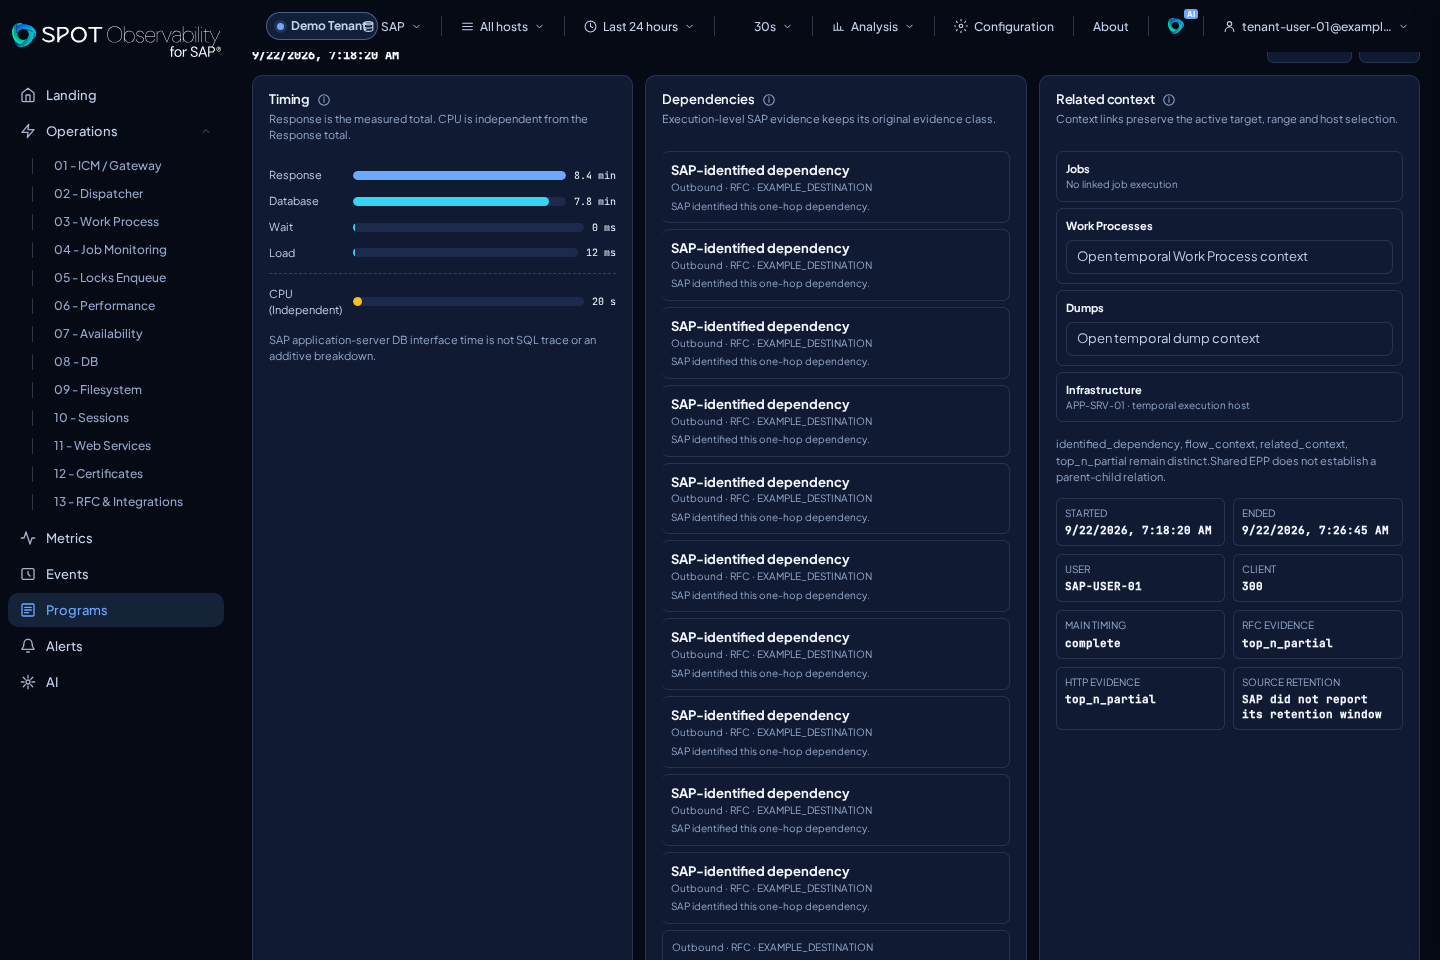
In the execution detail, Dependencies uses the full card body. Long lists scroll inside that card, so you can reach the final entry without losing the timings and related context; on narrow screens the card stacks and bounds the scroll to the available viewport. Short lists retain their natural height.
The Outbound destinations tab and its contracts remain unchanged, but the current standard collection requests main records only. It does not collect nested batch-step, RFC, HTTP, or EPP enrichment: all four subcapabilities are explicitly unavailable, and SPOT does not manufacture Jobs, dependencies, or EPP context. An empty table does not prove that no calls occurred.
SPOT retains separate evidence for:
- Related context: the same program appears in a Work Process or dump within five minutes before or after the measured start, bounded by the global range and host. At most 200 matches are returned, and this does not prove causation.
Partial means that primary executions are complete for the acknowledged
interval and optional enrichment is unavailable; it does not describe a
partial commit.
The execution detail and interval manifest show
source_retention_window_not_reported when SAP does not publish how much
history it retains. This is explicit coverage, not an estimate: SPOT does not
turn that signal into a number of hours or days or present data outside the
source retention window as complete.
Programs does not collect SQL text or parameters, RFC/HTTP payloads, or the internal ABAP function, method, and subroutine call tree. Use SAT, ST05, or other specialized SAP tools for that depth.
SAP availability and permissions
The connection uses the standard RFC function SWNC_GET_STATRECS_FRAME in the
SCSM_NW_WORKLOAD group; it requires no transport or custom ABAP code. The
technical user needs minimum S_RFC access to that function. SPOT requests a
UTC window with the SAP TTZZ code UTC, pins READ_CLIENT to the connection's
exact client, and sends READ_START_DATE/TIME and READ_END_DATE/TIME. Before
invoke, the same descriptor must declare MAX_RECORDS as an optional IMPORT INT with default -1, READ_ONLY_MAINRECORDS as IMPORT CHAR, and
ALL_STATRECS/PROTOCOL as EXPORT TABLE. SPOT sends
READ_ONLY_MAINRECORDS="X", omits MAX_RECORDS, and applies its native default;
it sends no artificial limit. This retains every main record without decoding
optional nested enrichment.
Each cycle rereads a
15-minute overlap and attempts to advance at most 30 minutes from the cursor,
splitting up to 45 minutes of coverage into leaves no wider than 60 seconds.
The configured IANA name is not sent to SAP's TZNZONE field. Compatibility
depends on the release, the function being remote-enabled, and SAP retention.
Record count is not a saturation signal: more than 500 valid records may form
one complete leaf. The protocol may be empty or contain only completion rows
with the six standard columns and a decimal-zero RC. A missing, ambiguous,
differently shaped, or non-zero protocol leaves the leaf unconfirmed; SPOT does
not log the protocol error text. Explicit truncation also leaves the leaf pending and may be split down to
one second. The connector admits at most 32 Programs RFC reads in any rolling
60 seconds across all sources. The budget survives reloads and restarts;
waiting for capacity holds neither a SAP connection nor a worker. The
continuation remains durable. Each complete leaf carries a manifest for its exact bounds. SPOT exports
that leaf and advances its checkpoint only after acknowledgement; overlap
leaves reconcile late arrivals without moving the checkpoint backwards. If a
later leaf saturates, times out, is cancelled, fails validation, or is not
acknowledged, that leaf remains pending and the cycle stops. Earlier
acknowledged leaves remain durable and are not read again, including during the
first cycle. SPOT preserves the exact pending subwindows and retries them with
backoff. Only after that horizon is complete does the next ordinary cycle
reread from 15 minutes before the last confirmed checkpoint. It never presents
an unread interval as covered. Each horizon advances at most 30 minutes. If
lag exceeds the collection interval plus 120 seconds, the next horizon starts
immediately; normal cadence resumes near the present. Check the last
confirmed SAP time, not only arrival.
Decoding is bounded to 20,000 rows and
64 MiB for each RFC result. A dense leaf that is fully decoded within that
budget can be confirmed: row count alone does not prove saturation. If SAP
reports saturation or truncation at the minimum one-second frame, SPOT fails
closed, neither exports nor confirms that leaf, and does not advance coverage.
SPOT retains at most 50,000 documents and 32 MiB of
serialized normalized content per leaf, including its manifest. If a limit is
exceeded, that leaf is neither exported nor confirmed. These Go
conversion and accumulation limits do not constrain memory used inside the
native RFC invoke. It does not claim support for every release or arbitrary
shape. The sanitized diagnosis distinguishes call-budget exhaustion,
minimum-frame saturation, an invalid window, aggregate-budget exhaustion, and
an identity/system conflict. A generic error from an earlier version does not
prove which class occurred. The SAP connection card can show:
partial: a valid read with complete main measurements and unavailablebatchstep,rfc,http, andeppoptional subcapabilities;unsupported: the release or exposed shape is not compatible;unauthorized: RFC permission is missing;unavailable: SAP was temporarily unavailable;error: the read was rejected or failed with a sanitized diagnosis.
An unavailable capability must not stop Metrics, Jobs, Work Processes, dumps, RFC failures, Certificates, or heartbeat.
When a valid round finishes with supported or partial status, SPOT first
exports the complete round, commits its checkpoint, and then retires the SAP
handle used by that round from the shared pool for the SAP source. That handle
may previously have been reused by another collection family, so a later
collection by Programs or any other family may need to reconnect. The pooling
policy of the other families is unchanged, and this does not imply a fresh
session for every round. partial describes optional coverage, not a partial
commit. Retiring the handle also does not guarantee that the native RFC runtime
immediately releases memory or lowers RSS.
Isolation and continuity
Each Program statistics attempt uses at most one global worker from the same signed connector. Before the child starts, source admission has an independent 30-second limit. Only after admission succeeds does it process one subwindow with a full 240-second budget and finite termination and reap reserves. A subwindow never inherits time left over from another read. An admission timeout or cancellation does not run the worker, bisect a subwindow, export, acknowledge, or move cursors; the next queued source can proceed. After a subwindow is acknowledged, its continuation is queued immediately and other pending sources receive the next turn first. Export has its own bounded deadline and does not reduce the next RFC budget. The parent retains only phase and duration. For descriptor lookup, parameter preparation, output selection, invoke, and decode, zero duration marks entry and a positive duration marks completion, even when the terminal record is missing. These boundaries contain no RFC values, identities, or payloads. They are diagnostic evidence and do not validate data or permit export, acknowledgement, or checkpoint movement. If the child reaches its exact 240-second deadline and the active subwindow is still splittable, the coordinator exports nothing and keeps the cursor and prior acknowledgements unchanged. It durably replaces only that subwindow with two contiguous halves, preserves the rest of the queue and its backoff, and queues the continuation immediately with fair scheduling. A rollout or reload cancellation takes precedence, never authorizes this split, and is reported as collection cancellation; a truly missing report remains an error. Metrics, Work Processes, Jobs, and the other priority families retain their independent schedules.
Subwindows start with a 60-second maximum per source. When a complete read takes at least 60 seconds or returns more than 400 main records, SPOT halves that source's maximum for pending work, down to one second. Exactly 400 records do not trigger the reduction, and every execution in the accepted leaf is retained. The reduction survives restarts, does not alter acknowledged coverage, and is not shared with another SAP source. Eight consecutive full-size, acknowledged, fast leaves (under ten seconds, at most 100 main records and 8 MiB normalized each) can double the maximum up to 60 seconds for the next horizon. A failure resets the streak; a timeout or saturation prevents growth for 15 minutes. Smaller leaves can require more RFC calls; at 32 admissions in 60 seconds the durable continuation waits for capacity. A small subwindow that still reaches the deadline remains a real stall, not a recovery. This adaptation reduces the expected working set but does not guarantee a universal memory ceiling for every SAP system.
This worker does not change Job Logs: its BAPI remains in-process and creates no children. Diagnostic memory is the maximum seen at sampling instants; compare it separately with cgroup pressure. The difference from the Go heap is a residual estimate, not a direct native-memory measurement.
If no programs appear
- Confirm the SAP system and range in the global bar; widen the range if SAP retention is short or the collection was just enabled.
- Check SAP connections > Program statistics, its last check, and state.
- For
unauthorized, reviewS_RFCforSWNC_GET_STATRECS_FRAMEwith the Basis team. - For
partial, use the complete main measurements and confirm thatbatchstep,rfc,http, andeppare unavailable; an absent relation does not mean “no call occurred”. - For
unsupported, verify the release and remote-enabled functions; do not install a custom Z artifact to force the result. - Confirm connector heartbeat and progress of the other collections. A single heartbeat does not prove that collection cycles keep completing. A valid empty result is No data, never synthetic zeros.
- Confirm that ABAP dumps still has a recent last check even when no new dump documents exist. No dumps is favourable evidence only while its collector keeps running. Correlate a Programs deadline with the dump time before attributing it; do not rely only on the historical count.
- On unmanaged Elasticsearch, if bootstrap reports
program_template_update_required, update the external template with the Programs fields. This preflight is separate from Job Logs'template_update_requiredand does not disable Job Logs whose mappings are already valid.
If the agent is under memory pressure
Evaluate the whole process. Check RSS/PSS, memory.high events, PSI, the
duration and result of Program statistics, and whether the other seven
collections keep advancing. Sustained reclaim without an OOM does not by itself
prove a Go heap leak or a native spin.
To recover continuity, temporarily disable only Program statistics on the affected connection, preserve a copy of the prior configuration, and keep the other collections enabled. Install a corrected, supported connector version, measure the whole process under real SAP load against available host headroom, and confirm that every family advances before re-enabling it. Keeping Programs disabled is a temporary mitigation, not a solution or stability proof. Do not raise the heap or resource limits as the first step. See the agent resource profile: a temporary override does not prove that the signed unit is installed or that Programs is stable.
Statistics records and subrecords depend on SAP configuration and retention. SPOT cannot reconstruct data already removed by SAP.