Global filters
Global filters define what data you see in Landing, Operations, Metrics, Events, Alerts, and AI.
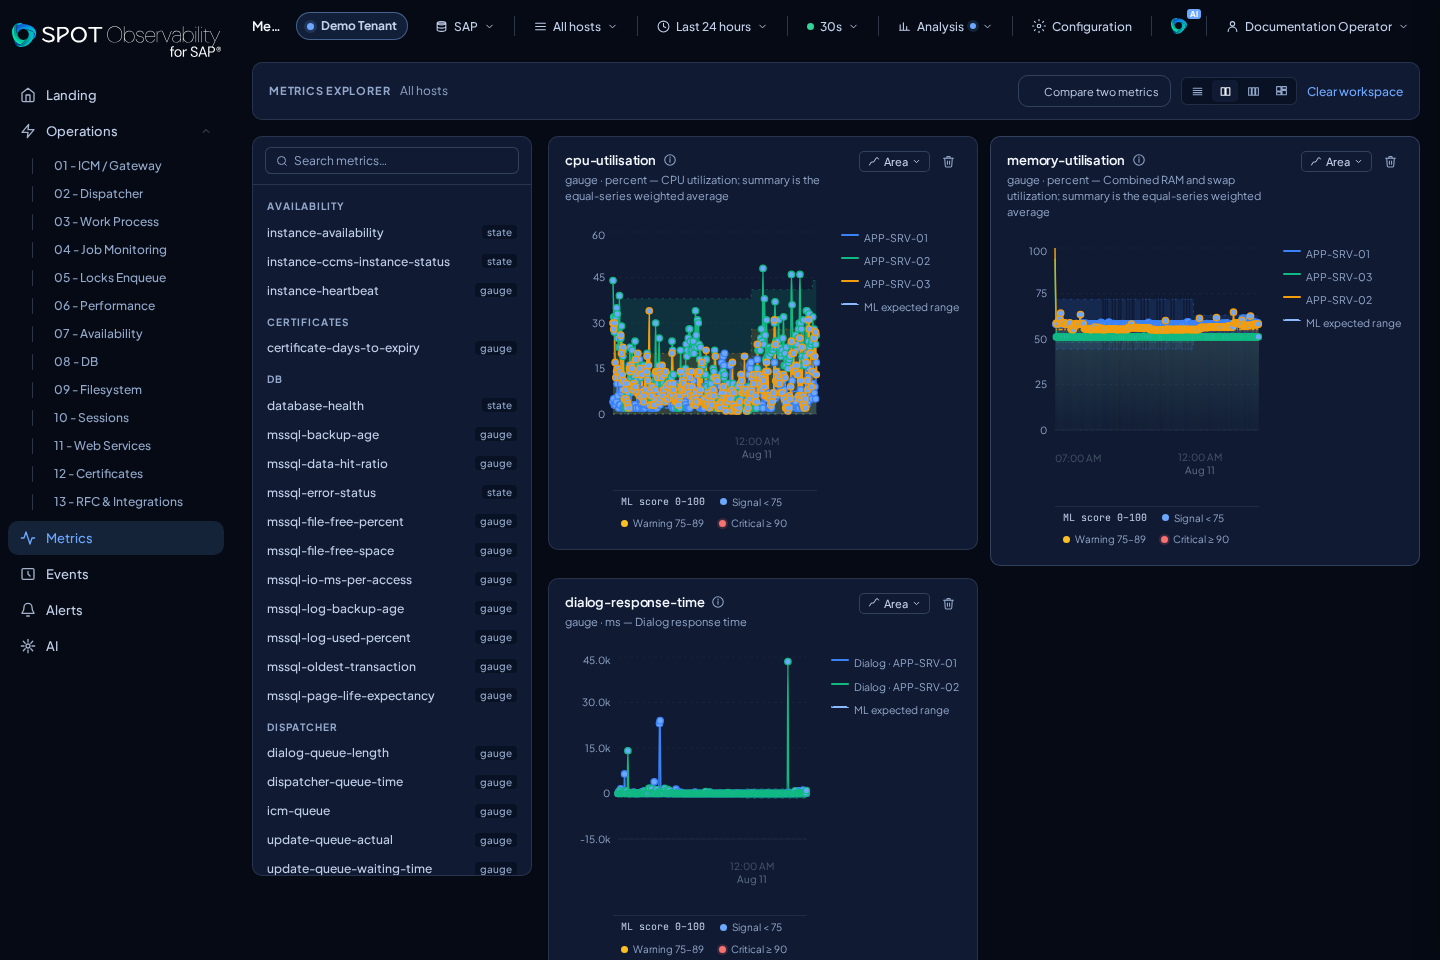
Main controls
- Target: active SAP system or read source.
- Time range: query window used by Operations, Metrics, Events, Alerts, and AI.
- Auto-refresh: automatically reloads all mounted data surfaces on one shared cadence.
- Host or instance: narrows views when the data supports host-level filtering.
- Analysis: optionally enables static thresholds, expected range, forecast, and ML score points. Every layer starts disabled.
- Theme/layout: changes display density or visual mode without changing data.
Recommendation
Start wide, such as the last 24 hours. When you find a specific event or alert, narrow the window around the affected minute and cross-check Jobs and Metrics.
Usage details
- In SaaS and on-premise, the top selector shows one SAP instance.
- Elasticsearch read scopes organize storage only in Configuration; they never appear as targets or change the meaning of alerts, thresholds, or AI.
- The host filter applies to screens with per-instance data.
- Relative presets—such as the last 15 minutes, 1 hour, 24 hours, 7 days, or
30 days—advance on every Auto-refresh cycle. Both
fromandtomove while preserving the selected duration. - The 30 days preset uses a minimum effective cadence of five minutes. SPOT keeps your preference for shorter windows; faster options are disabled while the 30-day preset is active.
- A Custom range keeps its exact boundaries. Every cycle queries those same boundaries again so late data can appear, but the window does not move.
Offstops periodic data polling. Initial loading and manual filter changes still query the backend.- SPOT pauses the data clock while the tab is hidden and performs one refresh when the tab becomes visible again.
- If a refresh is still running, SPOT does not start another in parallel; it merges pending ticks into one subsequent data wave.
- Landing can use its own current-health window. Use Operations or Metrics when you need exact historical analysis.
What happens during a refresh
When you enter a screen or change the target, global range, or hosts, SPOT prepares all visible resources together. The main area shows one indicator until tables, charts, and their time axes are ready; navigation remains available.
During Auto-refresh or after you select Refresh, confirmed content stays
visible and usable. A small indicator beside the interval shows activity, even
when Auto-refresh is Off. Scroll, focus, selection, tabs, and series options
stay in place. Table filters and pagination update only that panel.
When a relative window advances in the same context, temporal charts move smoothly for about 500 ms to their confirmed position. Axes and controls stay stable. The vertical scale does not contract in the same context and expands immediately for a new maximum or minimum. If the pointer or focus is already in the chart, SPOT updates directly and hides the previous tooltip until the next real pointer movement. A context change, no samples, analysis overlays (thresholds or ML), and a reduced-motion preference also update the chart directly.
SPOT cancels an update that exceeds 120 seconds and lets you retry. A temporary
failure keeps the last result from the same context and shows its success time.
A valid empty or UNKNOWN response replaces the previous result. A session,
tenant, target, or global-context change never reuses data from the prior
context.
Tenant Console in SaaS
When Tenant Console opens, SPOT preserves the current page, filters, query, and
hash. Switching console tabs keeps that context. Closing the console or using
Back returns to the exact origin. A direct /settings/... link without
previous context uses Landing as the safe background and close destination.