Navigation
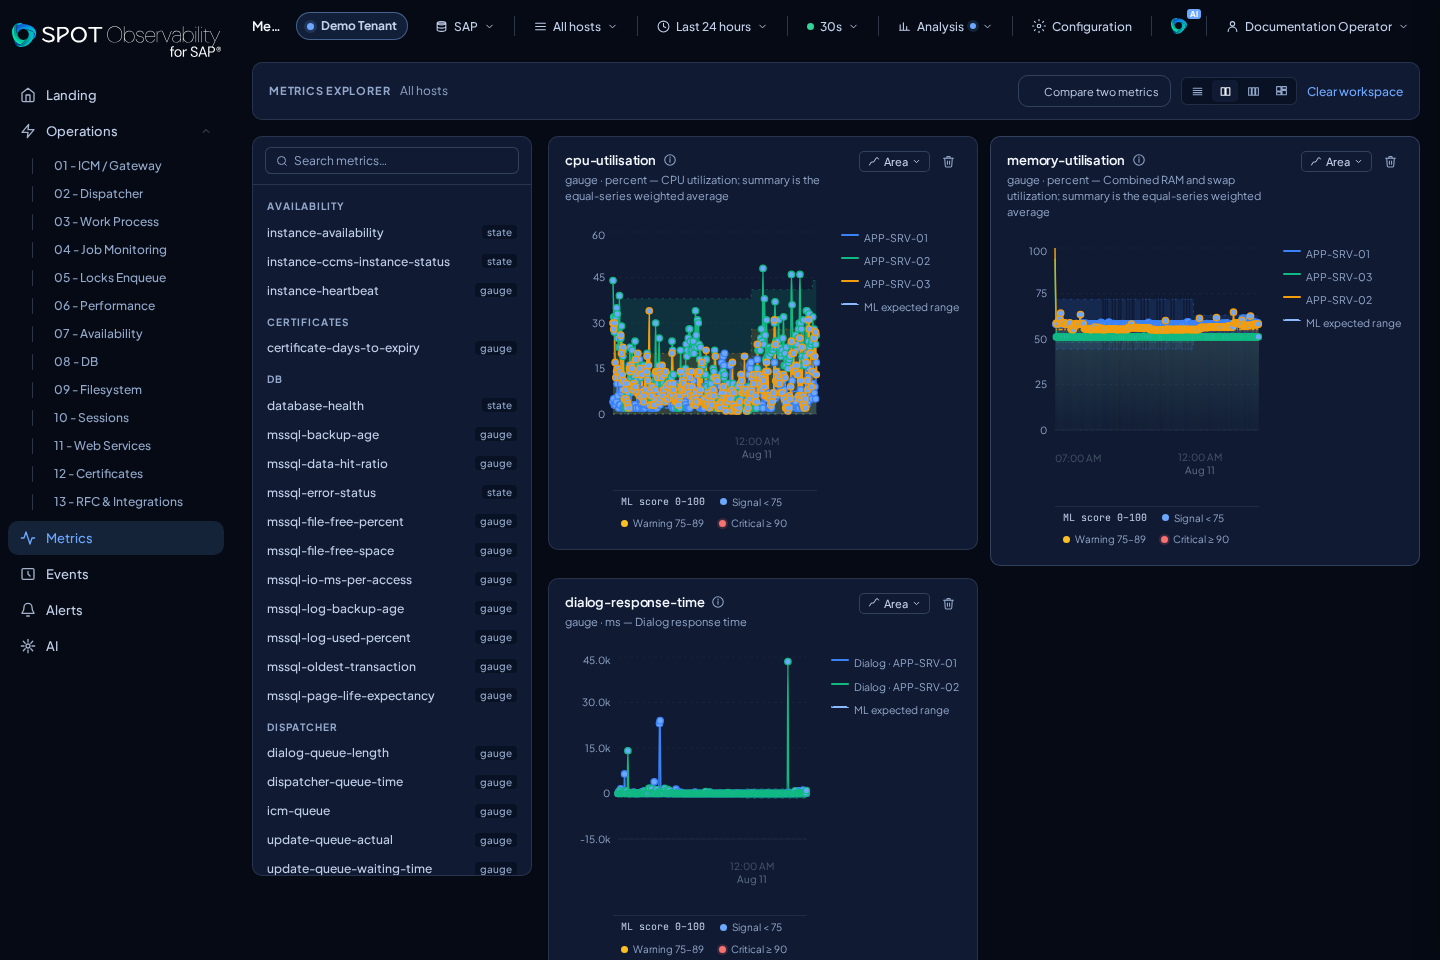
The main navigation is organized around daily operational screens.
| Entry | Purpose |
|---|---|
| Landing | Executive status and functional SAP map |
| Operations | SAP domains with KPIs and time series |
| Metrics | Metric investigation, comparison, and correlation |
| Events | Normalized messages, alerts, and events |
| Alerts | Alert evidence, history, and delivery control center |
| AI | Situation reports, RCA, and operational chat |
Global controls
The top bar contains:
- Target or SAP data source selector.
- Host filter.
- Time range.
- Refresh interval.
- Analysis menu for thresholds, expected range, forecast, and ML points.
- Theme selector.
- Configuration access, when your role allows it.
Selecting a target
The target defines where SPOT reads data from. In SaaS, it usually represents a SAP connection or source assigned to the tenant. In on-prem, it usually represents a configured read destination.
Use functional names in conversations and tickets, such as SAP Production, SAP QA, or SAP BW, instead of internal names.