Navigation
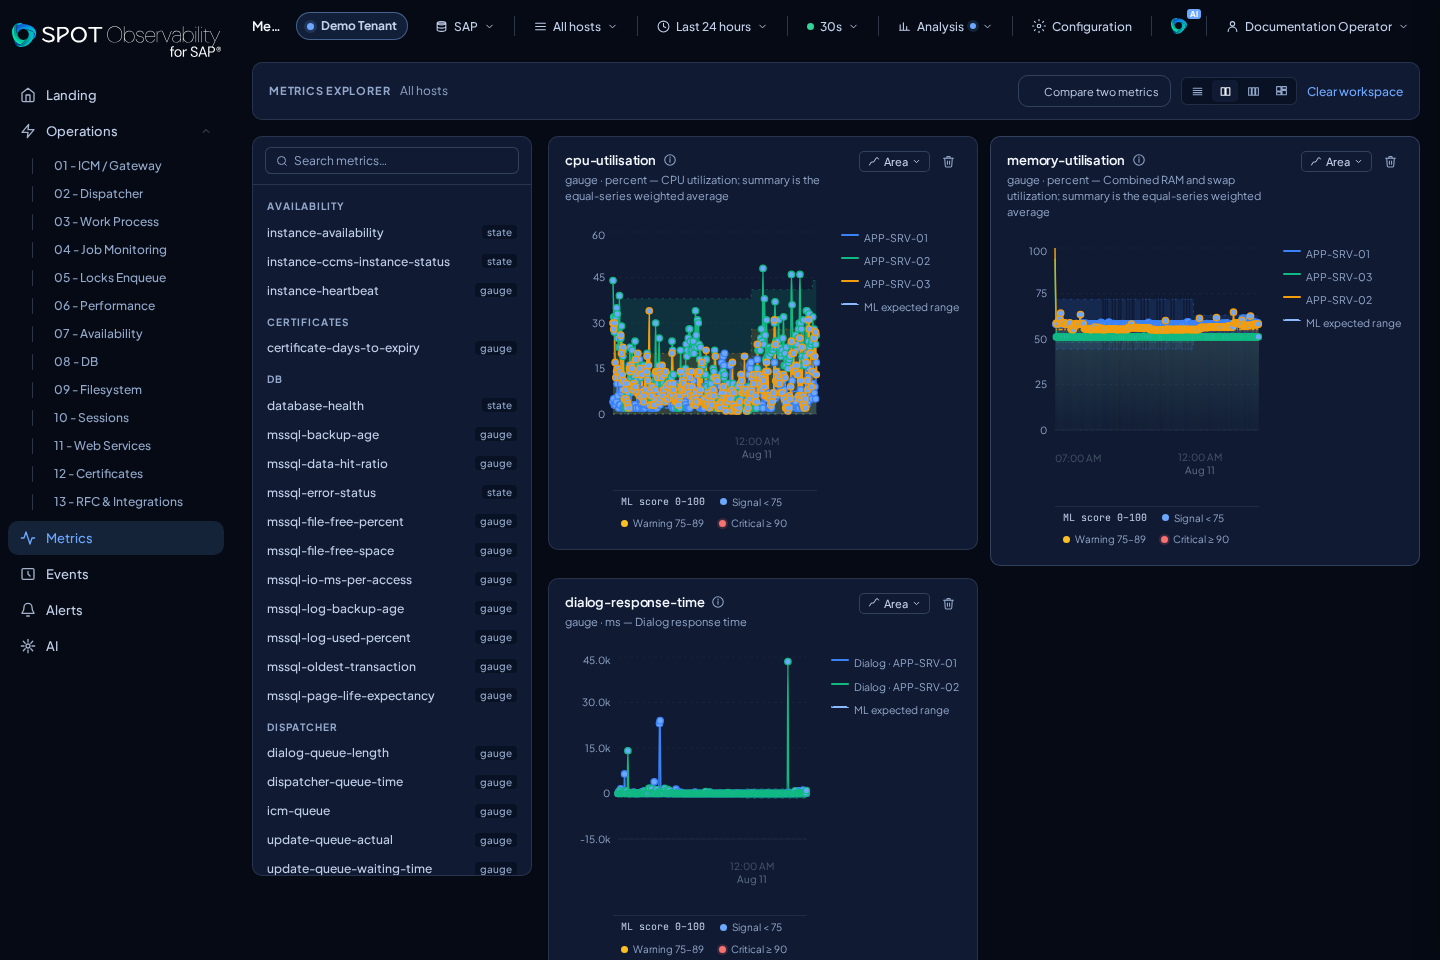
The main navigation is organized around daily operational screens.
| Entry | Purpose |
|---|---|
| Landing | Executive status and functional SAP map |
| Operations | SAP domains with KPIs and time series |
| Metrics | Metric investigation, comparison, and correlation |
| Events | Normalized messages, alerts, and events |
| Alerts | Alert evidence, history, and delivery control center |
| AI | Situation reports, RCA, and operational chat |
Global controls
The top bar contains:
- Target or SAP data source selector.
- Host filter.
- Time range.
- Refresh interval.
- Analysis menu for thresholds, expected range, forecast, and ML points.
- Theme selector.
- About, available to all users and roles.
- Configuration access, when your role allows it.
Selecting a target
The target always represents one SAP instance. In SaaS it is a SAP connection
registered in the tenant; on-prem it is the source_id discovered through a
read scope. An Elasticsearch cluster or namespace is never a target. SPOT
selects the only SAP automatically; with several, choose one before querying.
Use functional names in conversations and tickets, such as SAP Production, SAP QA, or SAP BW, instead of internal names.
Checking the edition and version
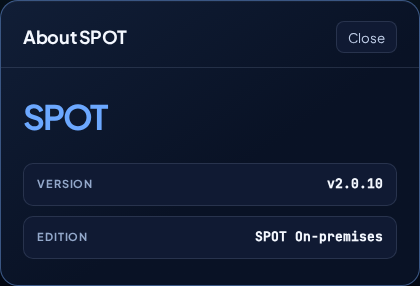
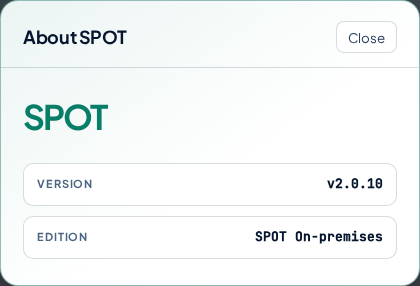
Open About from the top bar. Any user, including the viewer role, can
check the product name, deployed edition (SPOT SaaS or SPOT On-premises),
and the exact version currently running. The dialog keeps clear contrast in the
opaque Dawn and Midnight themes, locks page scrolling while open, and
contains no customer or connection data. Escape closes it and returns focus to
the About button.